Band 5.5 IELTS Writing Task 1 Model Answer
Overall Band Score: 5.5 · Cambridge IELTS 12 · 2026-11-08
IELTS Writing Task 1 question
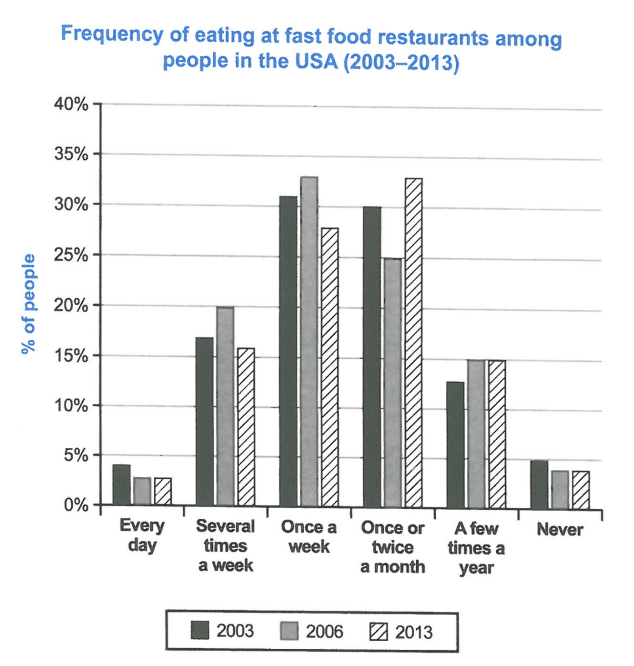
The chart below shows how frequently people in the USA ate in fast food restaurants between 2003 and 2013.
Summarise the information by selecting and reporting the main features, and make comparisons where relevant.
Student answer (Band 5.5)
The bar chart illustrates the percentage of people who ate fast food in restaurants in the United States Of America in 2003 and 2013.
It is clear that the highest percentage of people was ate fast food in restaurants at once a week and once or twice a month in the USA. In contrast, the proportion of people ate junk food in restaurants in every day and never were the lowest in the given periods.
In terms of once a week and once or twice a month, a significant percentage of people were ate fastfood in restaurant in 2006 at 33% and this figure for 2003 and 2013 were 31%, 27% and 30%, 25% respectively. In addition, from 2003 to 2013, the proportion of individual who ate fast food in restaurant in several times a week were 17%, 20% and 16%.
For remaining source of information, in 2003 at 13% and in 2006 & 2013 at 15% of people who ate junk food in restaurants in a few times a year. Moreover, every day and never were the least popular day rather than others categories where people ate junk food less than 5% in every year.
AI examiner evaluation
| Criterion | Band |
|---|---|
| Task Achievement / Task Response | 6.0 |
| Coherence and Cohesion | 6.0 |
| Lexical Resource | 5.5 |
| Grammatical Range and Accuracy | 5.0 |
| Overall | 5.5 |
Task Achievement / Task Response: Band 6.0
You identify the main pattern that weekly and monthly visits were the most common, while daily visits and never eating fast food were least common. You also include relevant figures for several categories, such as weekly visits peaking at 33% in 2006 and monthly visits reaching 33% in 2013. However, the overview is not fully accurate: it groups weekly and monthly eating as the highest in general without explaining that the leading category changed over time. There is also a confusing sequence in “31%, 27% and 30%, 25%,” which does not clearly match the years and categories; the chart shows weekly figures of 31%, 33% and 28%, and monthly figures of 30%, 25% and 33%. A clearer overview and more precise comparisons would strengthen the report.
Coherence and Cohesion: Band 6.0
The response has a recognisable structure: an introduction, an overview, and two paragraphs of supporting details. This gives the information a coherent overall arrangement, and phrases such as “In contrast” and “In addition” help signal relationships. However, progression within the third paragraph is weakened by the unclear comparison “31%, 27% and 30%, 25% respectively,” where the reader cannot confidently identify which figures belong to which years or categories. The final paragraph also begins “For remaining source of information,” which does not clearly connect to the categories being discussed. Use one paragraph for the main high-frequency categories and another for the lower-frequency ones, and make each comparison explicit by naming the category and years.
Lexical Resource: Band 5.5
You use a reasonable range of task-related vocabulary, including “percentage,” “proportion,” “significant,” and “least popular,” so the chart’s subject is generally clear. However, several word choices and collocations are inaccurate or repetitive. “Ate fast food in restaurants in every day” is not a natural expression, and “least popular day” incorrectly describes frequency categories rather than days. “Remaining source of information” is also an unsuitable phrase for the remaining chart categories. Spelling and presentation are inconsistent in “fastfood” and “United States Of America.” Aim for precise, natural chart language and avoid switching between “fast food” and “junk food,” since the chart specifically refers to fast-food restaurants.
Grammatical Range and Accuracy: Band 5.0
You attempt both simple and more complex sentence forms, including an overview with a contrast and sentences beginning “In terms of” and “Moreover.” However, errors in verb forms and sentence construction are noticeable. For example, “the highest percentage of people was ate” should use a construction such as “the highest percentages were for people who ate,” while “people were ate” should be “people ate.” In “the proportion of individual who ate … were,” the singular subject does not agree with the plural verb, and the sentence’s number sequence is difficult to parse. Articles and prepositions also need attention, as in “in a few times a year.” Practise building accurate comparison sentences before adding more complex structures.
See this exact question answered at other band scores. The same prompt compared across bands.
Browse more IELTS Writing model answers or get your own writing scored by the same AI examiner.