Band 5.5 IELTS Writing Task 1 Model Answer
Overall Band Score: 5.5 · Cambridge IELTS 12 · 2026-11-08
IELTS Writing Task 1 question
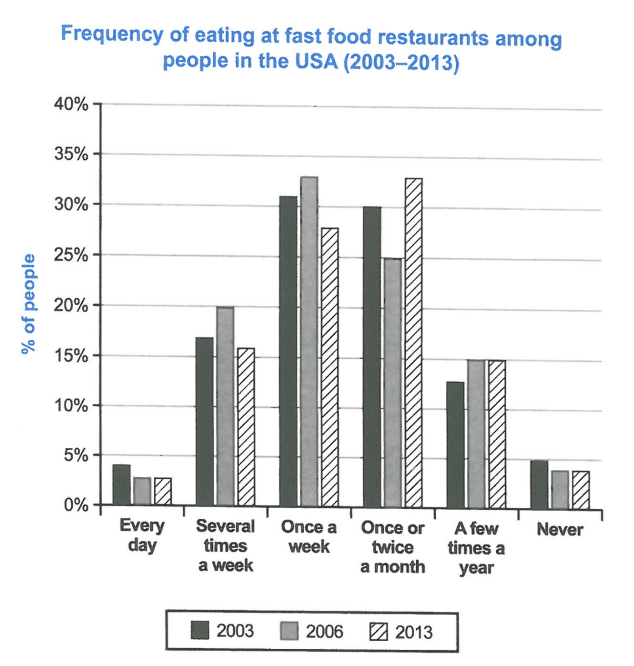
The chart below shows how frequently people in the USA ate in fast food restaurants between 2003 and 2013.
Summarise the information by selecting and reporting the main features, and make comparisons where relevant.
Student answer (Band 5.5)
The bar graph below gives us information about how regularly people in the USA ate in fast food restaurants between 2003 and 2013. Overall, in whole years people mostly rush towards restaurants once a week and once or twice a month. In comparison the lowest ratio is seen in every day visit and never visit.
Firstly, people of USA go to fast food restaurants on every day and never basis ratio were almost same under 5% from 2003 to 2013. Secondly, in 2003 almost 16% of people travel several times a week to restaurants and in 2006 it slightly increase to 20% of people and in 2013 again decrease is seen to around 15%.
Thirdly, in 2003 approximately 31% people once a week visit restaurants and in 2006 around 33% people and in 2013 almost 27% people. Forthly, people eat fast food once or twice a month and in 2003 their percentage was 30% and in 2006, 25%. Furthermore, in 2013 around 33%. Lastly. in 2003 around 13% people consume fast food few times in a year and in 2006 and 2013 equal 15% of people.
AI examiner evaluation
| Criterion | Band |
|---|---|
| Task Achievement / Task Response | 6.0 |
| Coherence and Cohesion | 5.5 |
| Lexical Resource | 5.5 |
| Grammatical Range and Accuracy | 5.0 |
| Overall | 5.5 |
Task Achievement / Task Response: Band 6.0
You cover all six frequency categories and report the main pattern that weekly and monthly visits were common, while daily visits and never eating there were least common. Most figures are close to the chart, including the rise in several-times-a-week visits to 20% in 2006 and the monthly figure reaching about 33% in 2013. However, the overview is imprecise: “in whole years” is unclear, and it would be stronger to identify the key shift from weekly visits being highest in 2003 and 2006 to monthly visits being highest in 2013. Some details are less accurate, such as giving 16% rather than 17% for 2003 several-times-a-week visits and 27% rather than 28% for weekly visits in 2013. The response is relevant, but the overview and comparisons need clearer emphasis.
Coherence and Cohesion: Band 5.5
The response has a recognisable sequence: an introduction and overview are followed by details for the different categories. Connectors such as “Firstly,” “Secondly,” and “Furthermore” help signal movement between points. However, the repeated numbered transitions make the report feel mechanical, and the categories are presented one after another rather than grouped to highlight meaningful comparisons. The sentence beginning “Firstly, people of USA…” is difficult to follow because it combines daily and never visits without clearly stating how their figures change. “Lastly. in 2003…” also has faulty punctuation that interrupts the flow. Grouping the low-frequency categories together and comparing the weekly and monthly patterns in a separate paragraph would create clearer progression and more effective cohesion.
Lexical Resource: Band 5.5
You use enough vocabulary to describe the chart, including “approximately,” “slightly increase,” “decrease,” and “percentage,” and the reader can generally understand the intended comparisons. However, several choices are unnatural or imprecise for a data report: people “rush towards” restaurants, “travel” to them, and visit on an “every day and never basis.” “Ratio” is also not the right term for the percentages shown. Repetition of “people,” “restaurants,” and “around” limits the range, while “Forthly” is misspelled and “consume fast food few times in a year” is awkwardly phrased. Aim for standard chart language such as “the proportion of people,” “ate out,” and “accounted for,” and use these expressions accurately rather than relying on repeated sequencing words.
Grammatical Range and Accuracy: Band 5.0
You attempt both simple statements and longer sentences, and the main figures are usually understandable. However, control of sentence structure and verb forms is inconsistent. For example, “people of USA go … ratio were almost same” has problems with articles, agreement, and sentence construction; “it slightly increase to 20%” needs a past-tense verb; and “in 2003 approximately 31% people once a week visit restaurants” has an awkward word order and missing grammatical elements. The sentence “in 2006 and 2013 equal 15% of people” is also incomplete. Punctuation is sometimes faulty, as in “Lastly.” followed by a lower-case continuation. Practise complete, clearly structured comparison sentences and check tense, articles, and subject–verb agreement; greater accuracy across these patterns would make the report easier to read.
See this exact question answered at other band scores. The same prompt compared across bands.
Browse more IELTS Writing model answers or get your own writing scored by the same AI examiner.