Band 6.0 IELTS Writing Task 1 Model Answer
Overall Band Score: 6.0 · IELTS Predictions Nov 2026 · 2026-11-06
IELTS Writing Task 1 question
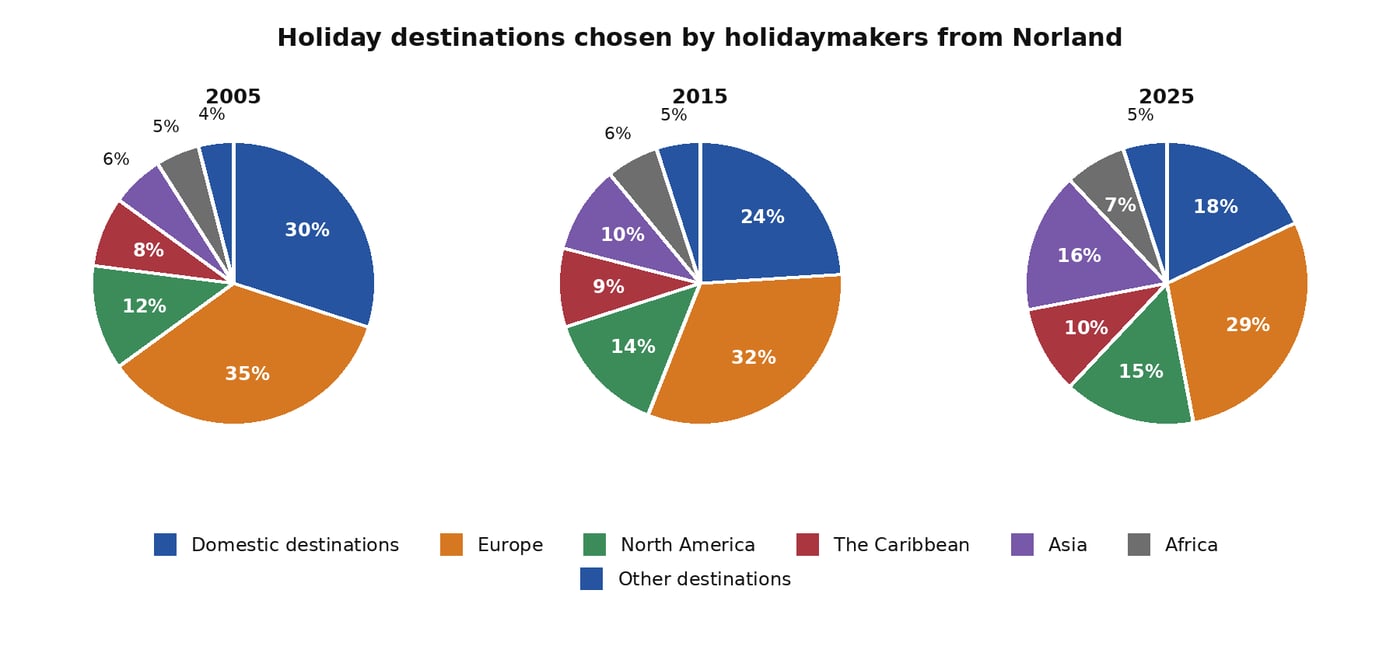
The pie charts below show the destinations chosen by holidaymakers from Norland in 2005, 2015 and 2025.
Summarise the information by selecting and reporting the main features, and make comparisons where relevant.
Student answer (Band 6.0)
The pie charts compare the desired destination chosen by holidaymakers categoried by 7 different places in norland between 2005 and 2025.
Overall, from the pie charts most tourist chose Europe for their primary destination and the other destination were least favorable among holidaytaker in every year.
Firstly, Europe was the biggest area for tourtakers in 2005 the number accounted for 35%, the number of tourist fall gradually 32% at 2015 and stood at 29% in 2025. Domistic destination was the second favorable place among holidaymaker,in 2005 the number of holidaytaker was at 30% and fall to 18% in 2025.
On the other hand, the number of holidaytaker increased similarly in North America and the caribbean from 12% and 8% in 2005 to 10% and 15% in 2025 respectedly. The number for asian holidaytaker experienced more than double, 6% in 2005 and 16% in 2025. A slightly rise seen in africa from 5% to 7% over the year.however Other destination remained as the least chosen place 4% in 2005 rose to 5% in 2015 and reamin steady in 2025.
AI examiner evaluation
| Criterion | Band |
|---|---|
| Task Achievement / Task Response | 6.5 |
| Coherence and Cohesion | 6.5 |
| Lexical Resource | 5.5 |
| Grammatical Range and Accuracy | 5.0 |
| Overall | 6.0 |
Task Achievement / Task Response: Band 6.5
You identify the main pattern accurately: Europe is the leading destination throughout, while “Other destinations” remain the least popular, and you report the decline in Europe and domestic travel alongside growth in Asia. The figures for these trends are generally grounded in the charts. However, one comparison is unclear or inaccurate: you say North America and the Caribbean rose “from 12% and 8% … to 10% and 15%,” but by 2025 North America is 15% and the Caribbean is 10%, so the final figures are reversed. The overview could also capture the broader shift from domestic/European trips towards Asia. This covers the task well overall, but some selected comparisons are less clearly reported than others; precise pairing of categories and figures would strengthen it further.
Coherence and Cohesion: Band 6.5
The response has a clear overall structure: an introduction, a brief overview, and two paragraphs grouping the larger and smaller destinations. The sequence from Europe and domestic travel to the remaining categories is easy to follow, and phrases such as “On the other hand” and “however” help signal a change in focus. Some links are mechanical or do not express the relationship precisely, though, and the long final paragraph contains several separate comparisons without clear sentence boundaries. For example, the North America/Caribbean figures are difficult to track because the categories and values are not consistently paired. Use shorter, more controlled sentences and organise the smaller destinations into a clearer comparison to make progression smoother.
Lexical Resource: Band 5.5
You use relevant vocabulary for describing charts, including “accounted for,” “fall gradually,” “remained,” and “least chosen,” so the meaning is usually understandable. There is some attempt to vary wording, but several choices are inaccurate or repetitive: “desired destination” is less suitable than “holiday destination,” and “the number of tourist” is not a natural way to describe percentages. Spelling errors such as “categoried,” “Domistic,” “tourtakers,” “respectedly,” and “reamin” are noticeable and reduce precision. The range is sufficient to communicate the main trends, but control of word forms, spelling, and collocations is inconsistent. Aim for accurate, standard chart language rather than repeatedly substituting “number” for “proportion” or “share.”
Grammatical Range and Accuracy: Band 5.0
You attempt both simple and more extended sentence forms, including “Europe was the biggest area … the number accounted for 35%” and a sentence describing the rise in other destinations. However, sentence control is uneven, and errors sometimes make relationships between figures harder to understand. Examples include missing articles and plural forms in “most tourist chose,” tense/agreement problems in “the number … fall,” and the run-on construction “Domistic destination was the second favorable place …, in 2005…”. Punctuation is also inconsistent, with missing spaces after full stops and commas and a lower-case “however” after a sentence boundary. Practise building accurate sentences around a subject and verb, and use full stops to separate each comparison.
See this exact question answered at other band scores. The same prompt compared across bands.
Browse more IELTS Writing model answers or get your own writing scored by the same AI examiner.