Band 5.0 IELTS Writing Task 1 Model Answer
Overall Band Score: 5.0 · IELTS Predictions Nov 2026 · 2026-11-12
IELTS Writing Task 1 question
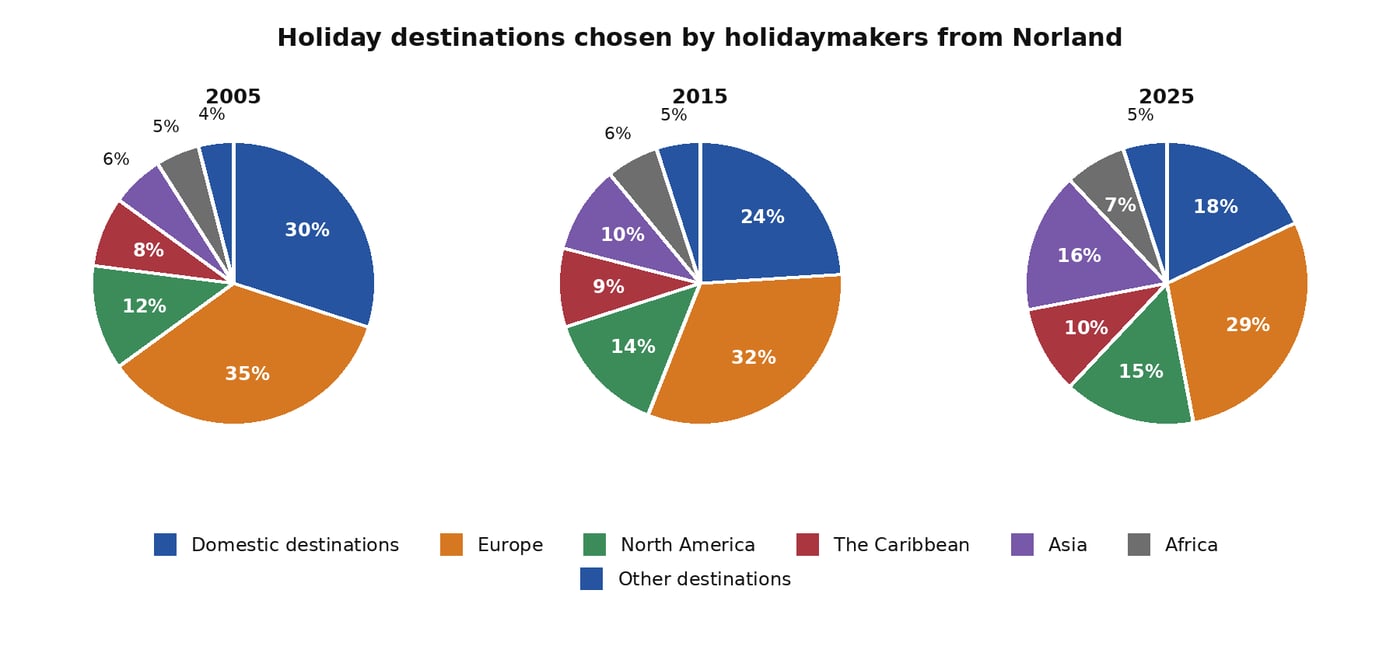
The pie charts below show the destinations chosen by holidaymakers from Norland in 2005, 2015 and 2025.
Summarise the information by selecting and reporting the main features, and make comparisons where relevant.
Student answer (Band 5.0)
The pie charts illustrate the information in the terms of percentage regarding the preferred holiday destination selected by tourists from norland during 2005 , 2015 and 2025.
From an overall perspective it is evident that Europe had the major share of the holiday destination.
As can be seen, in 2005 Europe had maximum number of tourist at 35% whereas other destination encountred lowest number of tourist at 4%. Additionally, 6% individuals visited Asia which was then followed by Africa at 5% during 2005. Moreover, group of individuals who visited North America and The Caribbean was at 12% and 8%. In addition this, 30% of the individuals went to other destinations.
Furthermore, not only during 2015 again most of the tourist visited Europe at 32% but also other destinations where the least visited place sitting at 5%. After this, It was noticed that number of individuals went to asia was at 10% which was then followed by The Caribbean at 9%. After that,
AI examiner evaluation
| Criterion | Band |
|---|---|
| Task Achievement / Task Response | 4.0 |
| Coherence and Cohesion | 5.0 |
| Lexical Resource | 5.5 |
| Grammatical Range and Accuracy | 5.5 |
| Overall | 5.0 |
Task Achievement / Task Response: Band 4.0
You identify Europe as the leading destination and report several accurate figures for 2005 and 2015, including Europe’s 35% and 32% shares and the smallest “other destinations” figures. However, the response gives no account of 2025, despite this being one of the three chart years, and the overview is too limited to summarise the main changes across the period. There is also a significant data error: the 30% who travelled domestically in 2005 are described as going to “other destinations.” The response therefore addresses the task only minimally, with important information omitted and some reporting inaccurate. Include all three years, compare the main rises and falls, and check each figure against its category.
Coherence and Cohesion: Band 5.0
The response has some basic organisation: it begins with an introduction and overview, then reports details for 2005 and 2015. Time markers such as “in 2005” and “during 2015” help the reader follow the sequence. However, there is no clear progression through the full set of charts, and the final sentence breaks off at “After that,” leaving the account unfinished. Several linking phrases—“Additionally,” “Moreover,” “In addition this,” and “After this”—are used mechanically to list details rather than show meaningful relationships. Paragraphing and a clearer structure would help: give a concise overview, then compare the years in a complete sequence, grouping the most important changes rather than listing categories one by one.
Lexical Resource: Band 5.5
You use enough topic vocabulary to communicate the subject, including “percentage,” “holiday destination,” “share,” and “visited.” There are also attempts at more formal reporting language, such as “From an overall perspective” and “it was noticed.” However, some expressions are unnatural or imprecise, including “in the terms of percentage,” “maximum number of tourist,” and “other destination encountred lowest number.” Spelling and capitalisation are inconsistent, as in “norland,” “asia,” and “encountred.” Repetition of “individuals” and “tourist” also limits flexibility. Aim for accurate, natural chart language—for example, describe a category’s “proportion” or “share,” and say that a destination “accounted for” a percentage. Check spelling and use category names consistently.
Grammatical Range and Accuracy: Band 5.5
You attempt both simple and more complex sentence forms, including the contrastive construction “not only … but also,” and most of the intended meaning can be understood. However, control is uneven. Examples include “Europe had maximum number of tourist,” which needs an article and a plural noun, and “group of individuals who visited North America and The Caribbean was at 12% and 8%,” where the subject and verb structure do not fit the two figures. The sentence beginning “Furthermore, not only during 2015…” is also awkwardly constructed, and punctuation spacing is inconsistent. Use straightforward, complete comparison sentences first, such as “Europe accounted for 35% in 2005, compared with 32% in 2015,” then add more complex structures only when their grammar is secure.
See this exact question answered at other band scores. The same prompt compared across bands.
Browse more IELTS Writing model answers or get your own writing scored by the same AI examiner.