Band 4.5 IELTS Writing Task 1 Model Answer
Overall Band Score: 4.5 · IELTS Predictions Nov 2026 · 2026-11-18
IELTS Writing Task 1 question
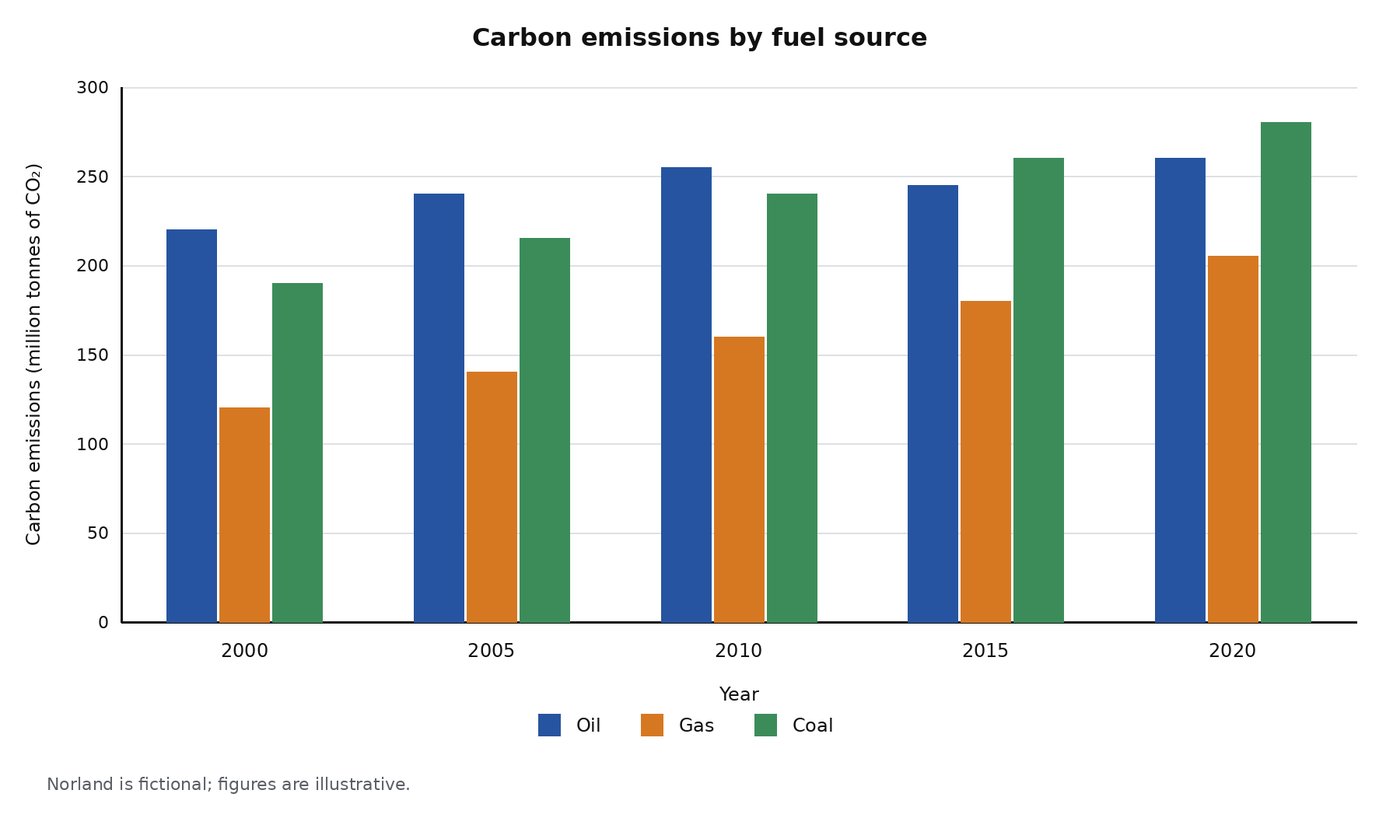
The bar chart below shows how much carbon dioxide was released by oil, gas and coal in the fictional country of Norland from 2000 to 2020.
Summarise the information by selecting and reporting the main features, and make comparisons where relevant.
Student answer (Band 4.5)
This prompt is a bar chart that illustrate the carbon emisiion (oil,coal and gas) in the fictional country of Norland from 2000 to 2020.
overall,oil,gas and coal are the carbon emisiions which is reportedly slightly increase from the respected years.but the coal rate is increased whereas the gas also went upword.
in 2000 the rate of oil is 230 approximate and te rate of coal is also went up and the gas rate is 150.in 2005 these fuel sources increased on the next years from 2010 to 2015 oil ratio in increaed but in 2015 coal goes up from 251 approximately.
in 2020 carbon emission from coal is surge from the oil and the gas ratio is also increased.
overall,oil is fluctuated in 2010 and the coal and gas ratio increased slightly
AI examiner evaluation
| Criterion | Band |
|---|---|
| Task Achievement / Task Response | 4.5 |
| Coherence and Cohesion | 4.0 |
| Lexical Resource | 5.0 |
| Grammatical Range and Accuracy | 4.5 |
| Overall | 4.5 |
Task Achievement / Task Response: Band 4.5
You identify the chart’s subject and time span, and you notice that gas and coal generally rise while oil fluctuates. However, the account is incomplete and several figures are inaccurate: for example, oil in 2000 is about 220, not 230, and gas is about 120, not 150. The overview is also unclear and repeated, and the key comparison—that coal rises above oil by 2015 and is highest in 2020—is not clearly reported. The response contains 122 words, below the required 150; the 10 words copied from the prompt were excluded from that count. Add a clear overview and select accurate start/end figures and major comparisons to develop the summary.
Coherence and Cohesion: Band 4.0
There is a basic attempt to move through the years, and the response includes an opening and overview-like statements. However, the information is not arranged into a clear progression: the second paragraph jumps from 2000 to 2005 and then groups 2010–2015 without explaining the changes, while the final overview repeats earlier points. Linking phrases such as “in 2005” and “in 2020” help signal time, but connections between ideas are often unclear, as in “the rate of coal is also went up and the gas rate is 150.” Use separate paragraphs for the overview and the main details, then compare the three fuels in a consistent chronological or trend-based order.
Lexical Resource: Band 5.0
You use some relevant chart vocabulary, including “carbon emission,” “rate,” “increased,” and “fluctuated,” so the topic is generally recognisable. However, the range is limited and several word choices or forms are inaccurate, which makes parts difficult to interpret. Examples include “emisiion,” “upword,” “ratio,” and “surge from the oil”; the last phrase does not clearly express that coal exceeded oil. Repetition of “rate” and “increased” also limits precision. Build a small set of accurate terms for describing quantities and trends, such as “emissions,” “figure,” “rose steadily,” “overtook,” and “remained higher than,” and check spelling before submitting.
Grammatical Range and Accuracy: Band 4.5
The response attempts both simple statements and longer sentences, but control is inconsistent and errors frequently affect clarity. For example, “This prompt is a bar chart that illustrate” has a subject–verb agreement error, while “the rate of coal is also went up” combines incompatible verb forms. The sentence beginning “in 2005” also lacks a clear grammatical structure, and punctuation and capitalisation are inconsistent, particularly after full stops. Most sentences rely on basic patterns, with little accurate use of complex clauses. Practise forming clear past-tense comparisons, for example, “Coal emissions rose from about 190 in 2000 to 280 in 2020,” and check agreement, verb forms, and sentence boundaries.
See this exact question answered at other band scores. The same prompt compared across bands.
Browse more IELTS Writing model answers or get your own writing scored by the same AI examiner.