Band 5.0 IELTS Writing Task 1 Model Answer
Overall Band Score: 5.0 · IELTS Predictions Nov 2026 · 2026-11-21
IELTS Writing Task 1 question
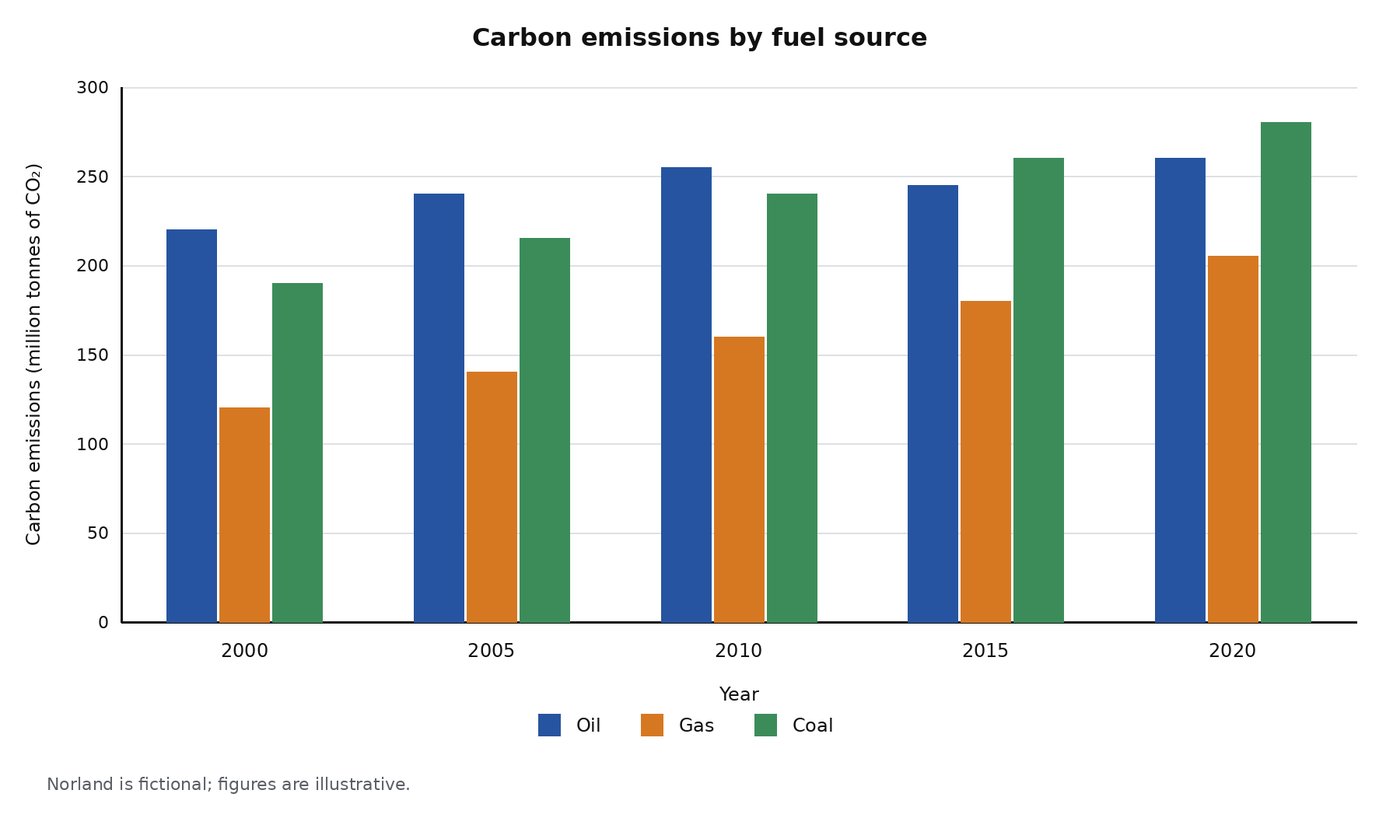
The bar chart below shows how much carbon dioxide was released by oil, gas and coal in the fictional country of Norland from 2000 to 2020.
Summarise the information by selecting and reporting the main features, and make comparisons where relevant.
Student answer (Band 5.0)
This bar chart gives information regarding carbon dioxide released in surrounding by different biofuels in norland from 2000 to 2020 .
Co2 emissions from oil from 2000 to 2020 is in nearly constant , it started from 220 in 2000 reached maximum 260 in 2010 .
While the co2 emission graph is in incline trend . It goes on from 120 Co2 emissions to 200 with in 20 years span .
Coal contribute most in Co2 emission as in 2000 ,Co2 emissions was 230 that reached to record 270 level with in 20 years span ,this trend is in increasing pattern.
This rate of carbon emission show how people use different fuel sources and what was impact on our enviornment. Coal contribute major role in carbon dioxide emisssion .
AI examiner evaluation
| Criterion | Band |
|---|---|
| Task Achievement / Task Response | 4.5 |
| Coherence and Cohesion | 5.0 |
| Lexical Resource | 5.0 |
| Grammatical Range and Accuracy | 5.0 |
| Overall | 5.0 |
Task Achievement / Task Response: Band 4.5
You identify the three fuel sources and describe the broad rise in gas and coal emissions, but the report only partially covers the chart and lacks a clear, accurate overview of its main comparisons. The oil figures are misreported: oil reaches its peak of about 260 in 2020, not 2010, and it is not simply constant. Coal rises from about 190 to 280, rather than 230 to 270; it becomes the largest source by 2015, a key comparison you could have highlighted. The final comments about people’s fuel use and environmental impact are not shown by the chart. The response is also 21 words below the required minimum. Add a concise overview and select accurate figures to support the main trends.
Coherence and Cohesion: Band 5.0
There is some basic organisation: the response moves from oil to gas and then coal, and phrases such as “While” and “with in 20 years span” attempt to connect ideas. However, the progression is not fully clear because there is no distinct overview, and the final environmental comments interrupt the chart description rather than summarising it. The opening sentence also does not establish a clear structure for the report. Several links are awkward or incomplete, such as “While the co2 emission graph is in incline trend,” which leaves the relationship to the previous point unclear. Group the trends into a short overview followed by comparisons, and use clear links such as “By contrast” or “Meanwhile” only where they accurately show the relationship.
Lexical Resource: Band 5.0
You use some relevant task vocabulary, including “emissions,” “maximum,” “increasing pattern,” and “fuel sources,” so the topic is generally recognisable. However, the range is limited and several choices are inaccurate or unnatural, which sometimes makes the meaning difficult to follow. “Released in surrounding” does not express the chart’s subject clearly, while “biofuels” is incorrect because the chart shows oil, gas and coal. Repetition of “Co2 emissions” and “trend” also limits precision. There are spelling and form errors, including “enviornment” and “emisssion.” Use standard terms such as “carbon emissions,” “rose steadily,” and “the highest-emitting source,” and check spelling and capitalization of CO₂.
Grammatical Range and Accuracy: Band 5.0
The response attempts a few different sentence forms, including a contrast beginning with “While” and a clause describing coal’s rise, but control is inconsistent. Errors in agreement and verb forms appear in “Co2 emissions from oil … is” and “Coal contribute,” while “it started from 220 … reached maximum” lacks a clear grammatical connection between the actions. The sentence beginning “While” is a fragment, and punctuation spacing is inconsistent. These problems make some relationships between figures and trends harder to understand. Practise complete sentences with a clear subject and verb, for example, “Oil emissions rose from about 220 in 2000 to 260 in 2020.” Then check agreement, articles, and sentence boundaries.
See this exact question answered at other band scores. The same prompt compared across bands.
Browse more IELTS Writing model answers or get your own writing scored by the same AI examiner.