Band 6.0 IELTS Writing Task 1 Model Answer
Overall Band Score: 6.0 · IELTS Predictions Nov 2026 · 2026-11-12
IELTS Writing Task 1 question
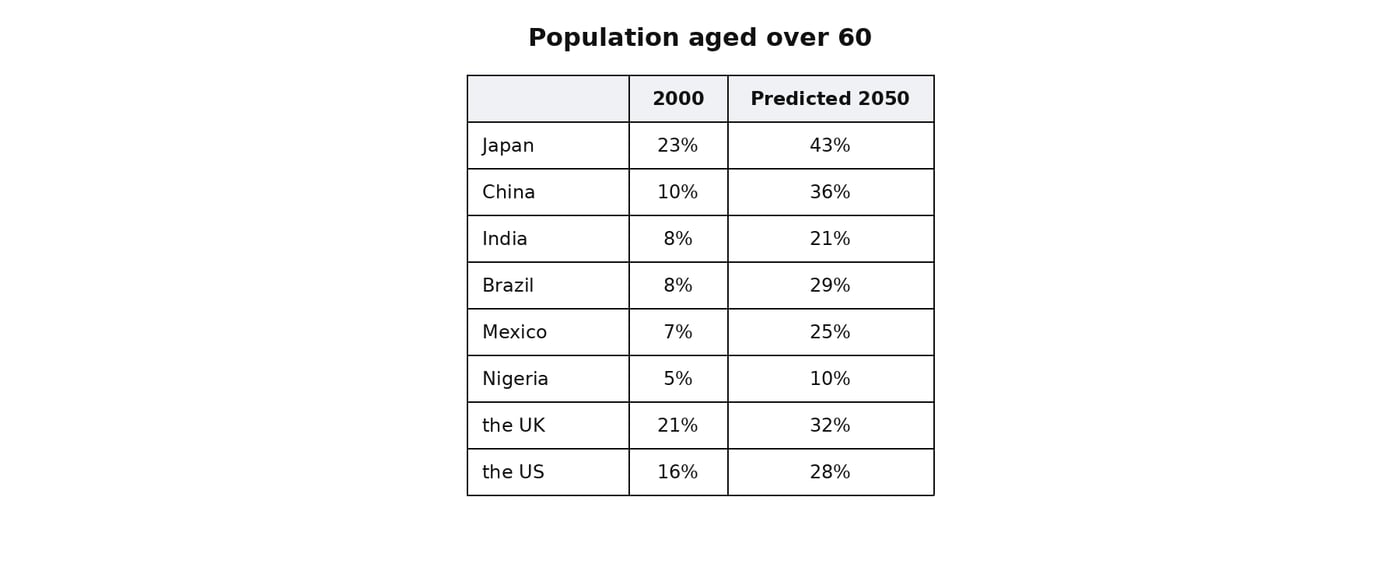
The table below shows the percentage of the population aged over 60 in 2000 and in the predicted year 2050 in eight countries.
Summarise the information by selecting and reporting the main features, and make comparisons where relevant.
Student answer (Band 6.0)
The table illustrates the percentage of the population who had age more than 60 in year 2000 and showing predication by year 2050 in eight different countries, namely, Japan, China, India, Brazil,Mexico, Nigeria, the UK and the US.
Overall, Japan had highest percentage of the population aged over 60 in the year 2000 and, this country will have highest population aged over 60 by the year 2050. On other side, Nigeria had the lowest pecentage of the population over age 60 in 2000, which will be same in the year 2050 among all eight countries.
In the year 2000, Japan was leading among all countries with highest percentage of the population at 23%. The UK and the US were held on second and third position with share of 21% and 16%, respectevely.While Chine was on 10%. India and Brazil had same share at 8%. Mexico was on second lowest position with 7% share. Nigeria was the only country who had lowest population aged over 60 with 5% share among all eight countries.
In the year 2050, japan will be on top in among all eight countries with share of 43%. It is predicted that China will hold second position among all eight countries with 36% share of population who will be aged over 60. Brazil and Mexico will have share more than triple as compare to year 2000 at 29% and 25%. Indian will have growth more than double.
AI examiner evaluation
| Criterion | Band |
|---|---|
| Task Achievement / Task Response | 6.0 |
| Coherence and Cohesion | 6.5 |
| Lexical Resource | 5.5 |
| Grammatical Range and Accuracy | 5.5 |
| Overall | 6.0 |
Task Achievement / Task Response: Band 6.0
You identify the main pattern accurately: Japan has the highest proportion in both years, while Nigeria remains lowest, and you report several key 2000 figures correctly. The comparisons for the UK, US, India and Brazil also help describe the starting point. However, the 2050 account is incomplete: you omit the predicted figures for the UK, US and Nigeria, and give no figure for India, despite noting that its share will more than double. The overview could also summarise the broad rise across all eight countries. Your statement that Brazil and Mexico will have “more than triple” their 2000 shares is inaccurate: Brazil rises from 8% to 29%, but Mexico rises from 7% to 25%, which is not more than triple. Covering these features more fully would make the summary more complete.
Coherence and Cohesion: Band 6.5
The response has a clear overall structure: an introduction, an overview, and separate paragraphs for the two years. This makes the information easy to follow, and phrases such as “In the year 2000” and “In the year 2050” signal the shift between periods. The progression is generally logical, and comparisons are grouped by year. To make the organisation more flexible and cohesive, avoid repeatedly framing countries as being “on top” or in a “position”; instead, connect figures through direct comparisons, such as contrasting Japan’s increase with Nigeria’s smaller rise. Some transitions are awkward, including “On other side” and “While Chine was on 10%,” and the final paragraph ends without a complete account of all countries. Clearer linking and a more balanced final paragraph would strengthen the flow.
Lexical Resource: Band 5.5
You use a relevant range of vocabulary for describing proportions and rankings, including “percentage,” “share,” “predicted,” “leading” and “lowest.” These choices generally communicate the intended comparisons. However, several word-choice and collocation problems make the language less natural: “had age more than 60” would be better expressed as “were aged over 60,” while “predication by year 2050” should be “a prediction for 2050.” “Held on second and third position” and “growth more than double” are also awkward formulations. There are noticeable spelling errors, including “pecentage,” “respectevely,” “Chine” and “japan.” Aim for accurate, conventional chart language and check spelling carefully; this will make your otherwise relevant vocabulary more precise and fluent.
Grammatical Range and Accuracy: Band 5.5
You attempt a mix of simple and more complex sentences, including relative clauses such as “which will be same in the year 2050” and a prediction introduced by “It is predicted that.” The main comparisons are usually understandable, but some grammatical errors recur. For example, the opening phrase “who had age more than 60” has an inaccurate clause structure, and “Japan had highest percentage” needs an article. In “In the year 2050, japan will be on top in among all eight countries,” the prepositions are not controlled, while “Brazil and Mexico will have share” lacks an article. The final sentence, “Indian will have growth more than double,” is also grammatically incomplete. Practise accurate articles, prepositions, and complete comparative clauses while retaining your attempts at varied sentence forms.
See this exact question answered at other band scores. The same prompt compared across bands.
Browse more IELTS Writing model answers or get your own writing scored by the same AI examiner.