Band 6.0 IELTS Writing Task 1 Model Answer
Overall Band Score: 6.0 · IELTS Predictions Nov 2026 · 2026-11-18
IELTS Writing Task 1 question
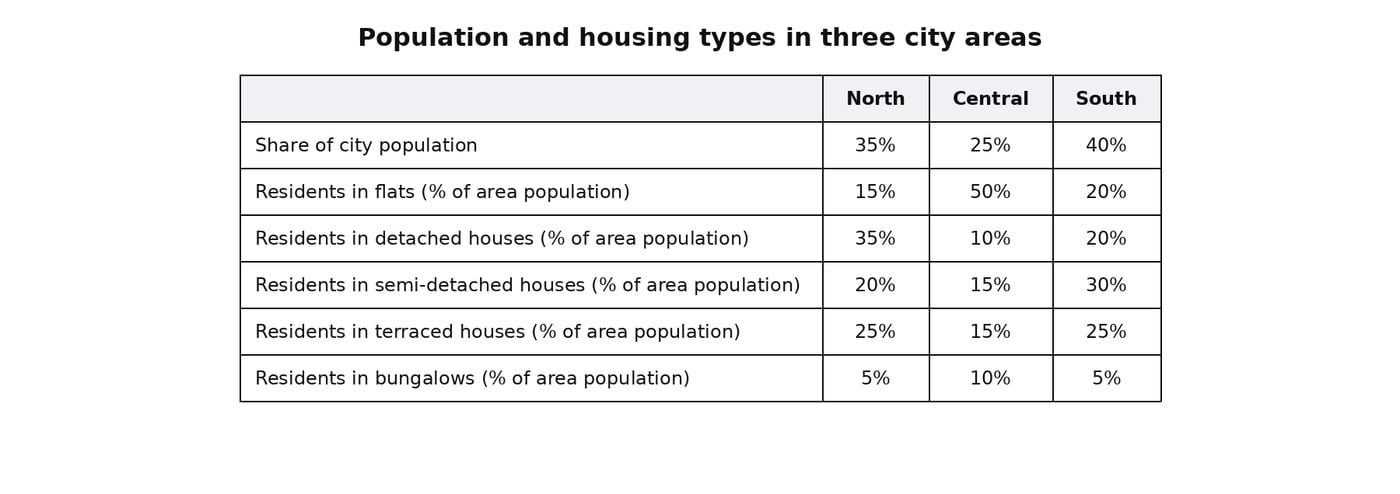
The table below shows each area's share of the city population and the percentages of its residents living in five types of home.
Summarise the information by selecting and reporting the main features, and make comparisons where relevant.
Student answer (Band 6.0)
The tabel given illustrates the data of a city population and aomparison of its proportion living in five types of residences.
Overall, the South area of city has the highest population share, with most people living in semi-detached houses. A large proportion of individuals in the Central area live in fltas and detached houses in the North area.
The highest population lives in the South (40%) of city, with 30% living in semi detached houses. An other 25% lives in terraced houses. People living in flats and detached houses are 20% each. A small percentage of 5% lives in bunglows.
The North of the city is a residence for 35% of city's population. A largest number of residents in the North lives in detached houses(35%) followed by terrace houses( 25%), semi-detached houses(20%), flats (15%) and bunglows(5%).
The Central area of the city shares 25% of city's population. Half of the population(50%) lives in flats in central area. Thsi figure is 15% each for semi-detached houses and terraced houses. Ten percent of residents in central area live in detached houses and and another 10% in bunglows.
Data shows that percentage of people living in bunglows is the smallest in all areas.
AI examiner evaluation
| Criterion | Band |
|---|---|
| Task Achievement / Task Response | 6.5 |
| Coherence and Cohesion | 6.5 |
| Lexical Resource | 5.5 |
| Grammatical Range and Accuracy | 5.5 |
| Overall | 6.0 |
Task Achievement / Task Response: Band 6.5
The response covers the table’s main categories and reports the figures accurately, including the South’s largest population share (40%), the Central area’s high proportion of flat residents (50%), and the North’s leading share of detached-house residents (35%). The overview identifies these key contrasts, and the final observation that bungalows have the smallest share in every area is also supported by the data. This gives the report a clear, relevant summary. To make the overview more complete and precise, state the main housing contrast across areas more directly—for example, that flats dominate in Central, while detached houses are most common in North and semi-detached houses in South. The claim that Central residents live in “flats and detached houses” is unclear because detached houses account for only 10% there.
Coherence and Cohesion: Band 6.5
The report has a coherent overall arrangement: it begins with an overview, then describes South, North and Central in separate paragraphs, before adding a concluding comparison about bungalows. This makes the information easy to locate, and sequencing details within each area is generally logical. However, the overview’s phrase “A large proportion of individuals in the Central area live in flats and detached houses in the North area” joins two comparisons awkwardly, so the relationship between the areas is not immediately clear. Some linking is also repetitive, particularly the repeated use of “lives” and lists connected by “followed by.” Use clearer contrast markers such as “whereas” and “by comparison,” and make the overview’s references explicit. These refinements would make progression smoother and cohesion less mechanical.
Lexical Resource: Band 5.5
The response uses enough topic vocabulary to describe the table, including “population share,” “semi-detached houses,” “terraced houses” and “residents.” It also attempts some variation with “individuals” and “a small percentage.” However, spelling errors are noticeable, including “tabel,” “aomparison,” “fltas,” “bunglows” and “Thsi,” and these reduce the accuracy of the vocabulary. Some expressions are also unnatural or imprecise: “a residence for 35% of city’s population” and “the highest population lives” are not suitable collocations for reporting proportions. Prefer concise, standard chart language such as “accounts for,” “residents,” and “the largest share.” More accurate spelling and more natural collocations would make the vocabulary clearer and more controlled.
Grammatical Range and Accuracy: Band 5.5
The response includes a mix of simple statements and more developed structures, such as “Overall, the South area of city has the highest population share, with most people living in semi-detached houses.” Most relationships between figures remain understandable. However, some grammatical errors recur. Articles and possessives are missing in phrases such as “of city” and “of city’s population”; the latter needs “the city’s population.” There are also agreement and sentence-pattern problems in “The highest population lives in the South” and “A largest number of residents … lives,” where the subject and verb construction should be revised. The final sentence, “Data shows,” also needs an article or plural agreement. Aim for consistently accurate patterns such as “The South accounts for 40% of the city’s population” and “The largest proportion of North residents live in detached houses.”
See this exact question answered at other band scores. The same prompt compared across bands.
Browse more IELTS Writing model answers or get your own writing scored by the same AI examiner.