Band 5.0 IELTS Writing Task 1 Model Answer
Overall Band Score: 5.0 · Recent IELTS Exams (Canada & India) · 2026-11-05
IELTS Writing Task 1 question
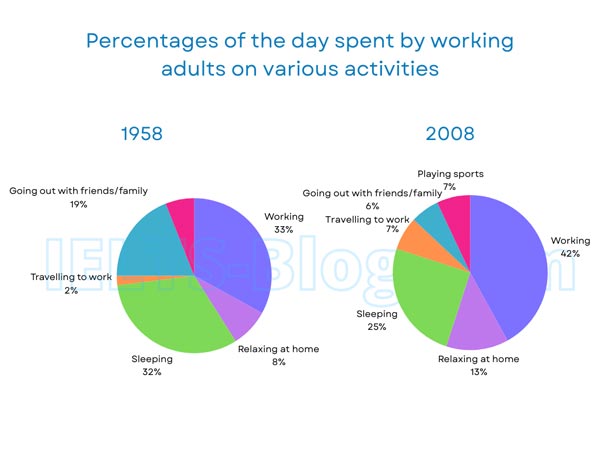
The pie charts below show how working adults in a particular country spent their time in 1958 and 2008.
Summarise the information by selecting and reporting the main features, and make comparisons where relevant.
* Note: these aren’t the original diagrams given in the test, they were recreated for the purpose of demonstration.
Student answer (Band 5.0)
The pie diagrams represent how employed mature people in a some nation utilise their time in 1958 and 2008.
Overall assessment, in this given data it shows percentaile of the mature individuals use their time by working on different kinds of activities in a particular region in year 1958 and 2008.
The given pie charts clearly illustrate information of various kinds of works or jobs such as in year 1958 to 2008 the proportion of hang out with friends and family is declined to 19% to 6% while, the proportion in working field is increased from 33% to 42%.However, in the year 2008 the playing sports activity is newely introduced and their percentage is 7%.Therefore, travelling to work is rised from 2% to 7%.
AI examiner evaluation
| Criterion | Band |
|---|---|
| Task Achievement / Task Response | 5.0 |
| Coherence and Cohesion | 5.0 |
| Lexical Resource | 5.0 |
| Grammatical Range and Accuracy | 5.0 |
| Overall | 5.0 |
Task Achievement / Task Response: Band 5.0
You identify several important changes accurately: working rises from 33% to 42%, socialising falls from 19% to 6%, and commuting increases from 2% to 7%; you also note that sports appears in 2008. However, the response only partly summarises the charts. It gives no figures or comparisons for sleeping or relaxing at home, and the overview repeats general wording rather than clearly highlighting the main pattern across the activities. The phrase “newly introduced” is also imprecise: sports is shown in 2008 but not in the 1958 chart. The response is 26 words below the required minimum, which limits the opportunity to select and report the main features fully. Include the missing categories and a concise overview of the largest changes.
Coherence and Cohesion: Band 5.0
There is some organisation: you begin with an introduction, provide an overview, and then mention several specific comparisons. This gives the reader a basic route through the response. However, the progression is not fully clear because the overview is vague and the final paragraph combines several figures without a consistent grouping or comparison. Linking words such as “However” and “Therefore” are used, but their relationships to the preceding ideas are not always logical; the appearance of sports does not explain the rise in commuting. The response would be clearer with distinct introduction, overview, and detail sections, grouping increases together and decreases together. Use connectors only where they accurately show contrast or consequence.
Lexical Resource: Band 5.0
You attempt a range of vocabulary related to the topic, including “proportion,” “declined,” “increased,” and “activity,” and the main comparisons can generally be understood. However, several choices are inaccurate or unnatural, such as “employed mature people,” “utilise their time,” “working field,” and “newely introduced.” “Percentaile” is also a spelling error, and “works or jobs” does not accurately describe all the chart categories. These noticeable problems make the description less precise and sometimes awkward. Aim for straightforward, accurate chart language: refer to “working adults,” “time spent on activities,” and the “share” or “percentage” for each category. Check spelling and use natural collocations when describing changes.
Grammatical Range and Accuracy: Band 5.0
You attempt both simple statements and longer sentences, including a comparison using “while,” so there is some effort to vary sentence structure. However, complex sentences are often faulty, and frequent errors affect clarity. For example, “in a some nation” has an incorrect article pattern, while “the proportion … is declined to 19% to 6%” has problems with verb form and the construction used to express a change. The sentence beginning “Overall assessment, in this given data” is also awkwardly formed, and missing spaces after full stops make the punctuation less controlled. Practise accurate comparative structures such as “fell from 19% to 6%” and “rose from 33% to 42%,” and check articles, tense, and sentence boundaries.
See this exact question answered at other band scores. The same prompt compared across bands.
Browse more IELTS Writing model answers or get your own writing scored by the same AI examiner.