Band 5.5 IELTS Writing Task 1 Model Answer
Overall Band Score: 5.5 · Recent IELTS Exams (Canada & India) · 2026-11-06
IELTS Writing Task 1 question
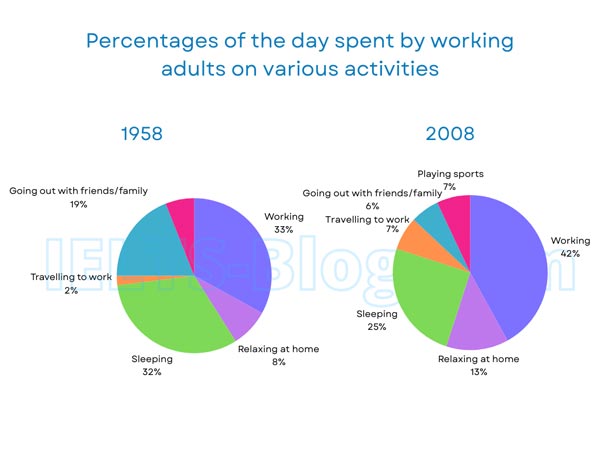
The pie charts below show how working adults in a particular country spent their time in 1958 and 2008.
Summarise the information by selecting and reporting the main features, and make comparisons where relevant.
* Note: these aren’t the original diagrams given in the test, they were recreated for the purpose of demonstration.
Student answer (Band 5.5)
The given pie chart demonstrates working adults in a particular country spent their time in the year 1958 to 2008.
Overall, it can be seen that, in the both years percentage of the day spent by working adults on various activities.
To begin with, in the year 1958, worked adults is a higher percentage which is 33% while sleeping is also second highest percentage which is 32%. In addition, individual going out with their friends and relatives which is around 19% and relaxed at home which is around 8%. Adults who are used travel to worked which is approximately 2%.
On the other hand, in the year 2008, adults who are worked which is around 42% as compared to 1958 there are higher. Moreover, people sleeping habit was decreased which is around 25%. Furthermore, played sport, traveling to worked and going with their families and friends which 7% respectively and relaxing at home which is increased 7% as compared to in the year 1958.
AI examiner evaluation
| Criterion | Band |
|---|---|
| Task Achievement / Task Response | 5.5 |
| Coherence and Cohesion | 5.5 |
| Lexical Resource | 5.0 |
| Grammatical Range and Accuracy | 5.0 |
| Overall | 5.5 |
Task Achievement / Task Response: Band 5.5
You identify several important figures, including work at 33% and 42%, sleep at 32% and 25%, and travel to work at 2% in 1958. However, the overview does not actually summarise the main changes: “in the both years percentage of the day spent … on various activities” is incomplete and gives no clear comparison. Some details are also inaccurate or unclear. In 2008, going out with friends and family was 6%, not 7%; only sports and commuting were 7%. Relaxing at home rose from 8% to 13%, a five-point increase, rather than seven. To strengthen the response, give a clear overview of the largest rises and falls, and report the categories and figures precisely.
Coherence and Cohesion: Band 5.5
The response has a basic structure, moving from an introduction to 1958 details and then to 2008, and phrases such as “To begin with” and “On the other hand” signal the shift between years. However, the overview is not a complete sentence, so the reader is not given a clear organising summary. Several later details are crowded into long sentences, especially the final sentence, where the activities and percentages are difficult to follow. Linking expressions such as “Moreover” and “Furthermore” are used, but they do not always clarify how the information relates. Group the main increases and decreases more deliberately, and use shorter, clearly connected comparisons to create a more consistent progression.
Lexical Resource: Band 5.0
You use relevant topic vocabulary, including “percentage,” “sleeping,” “relaxing at home,” and “travelling to work,” so the subject is generally recognisable. However, the range is limited and several phrases are awkward or imprecise, such as “worked adults,” “used travel to worked,” and “going with their families and friends.” Repetition of “which is around” also makes the description less fluent. Choose accurate activity labels and verbs that express change, such as “accounted for,” “rose,” and “fell,” while keeping the chart’s categories consistent. More natural collocations would make the comparisons clearer and reduce the effort required to interpret some details.
Grammatical Range and Accuracy: Band 5.0
There are attempts to form longer sentences and make comparisons, but grammatical control is inconsistent, and errors sometimes make the meaning difficult to follow. For example, “in the both years percentage …” lacks a complete clause, while “worked adults is a higher percentage” has problems with both the subject and verb construction. In “people sleeping habit was decreased,” the verb form and sentence structure are faulty. Articles, agreement, and tense also need attention. Practise building a clear basic pattern first—for example, “The proportion of adults who worked was 33%”—then add comparisons such as “This rose to 42% in 2008.” This will improve accuracy while allowing more varied sentence forms.
See this exact question answered at other band scores. The same prompt compared across bands.
Browse more IELTS Writing model answers or get your own writing scored by the same AI examiner.