Band 5.0 IELTS Writing Task 1 Model Answer
Overall Band Score: 5.0 · Recent IELTS Exams (Canada & India) · 2026-11-06
IELTS Writing Task 1 question
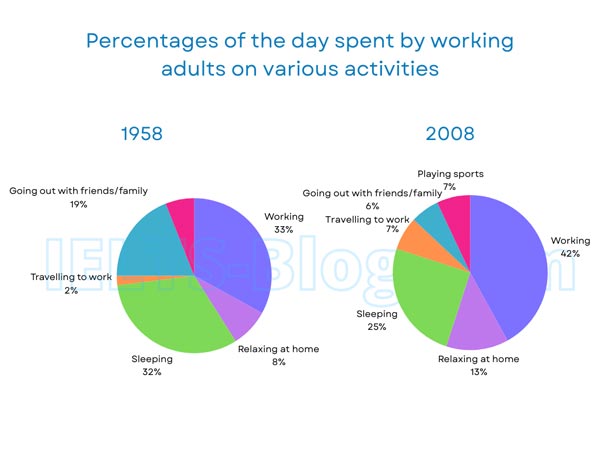
The pie charts below show how working adults in a particular country spent their time in 1958 and 2008.
Summarise the information by selecting and reporting the main features, and make comparisons where relevant.
* Note: these aren’t the original diagrams given in the test, they were recreated for the purpose of demonstration.
Student answer (Band 5.0)
The pie charts illustrates how working adults in a particular country spent their time in 1958 and 2008.
Overall, it is noticeable in 1958 the highest thing is working it is 33% and the lowest is travelling to work it is just 2%. On the other side, in 2008 the highest thing is working it is 42% and the lowest is going out with friends or family it is just 7%. If we comparison both 1958 and 2008, than we show that the percentage and difference between these. Like in 1958, going out with friends or family on priority base because it's percentage is 19% and the other side in 2008 it's percentage just 6%. In 1958, travelling to work just 2% and in 2008 increase to 7%. In 1958, sleeping is 32% but this percentage decreases to 25% in 2008. In 1958, working is 33% but later that increases to 42% in 2008. Relaxing at home in 1958 is 8% but it's increases to 13% in 2008. One thing is missing in 1958 is playing sports but in 2008 is 7% found that.
AI examiner evaluation
| Criterion | Band |
|---|---|
| Task Achievement / Task Response | 5.5 |
| Coherence and Cohesion | 4.5 |
| Lexical Resource | 5.0 |
| Grammatical Range and Accuracy | 5.0 |
| Overall | 5.0 |
Task Achievement / Task Response: Band 5.5
You report most of the chart categories and several figures accurately, including the rise in working from 33% to 42%, the fall in sleeping from 32% to 25%, and the increase in travel from 2% to 7%. You also identify the main pattern that work takes the largest share in both years. However, the overview is not fully accurate: in 2008, travelling to work and playing sports are tied for the lowest share at 7%, not going out with friends or family, which is 6%—in fact, 6% is the lowest. Your opening overview also focuses on highest and lowest values rather than summarising the broad changes. To strengthen the response, give a concise overview of the major shifts and check that each comparison matches the chart.
Coherence and Cohesion: Band 4.5
The response includes an introduction, an overview, and comparisons, so the reader can identify the two years being discussed. However, the progression is not consistently clear: the overview repeats figures that are then listed again, and the paragraph moves through categories without grouping the main increases and decreases. Linking phrases such as “On the other side” and “If we comparison both 1958 and 2008” are awkward or do not clearly signal the relationship between ideas. The final point about sports is added abruptly. Organise the report into a clear overview followed by grouped comparisons—for example, increases in work, travel and home relaxation, then decreases in sleep and socialising—and use accurate, varied links between them.
Lexical Resource: Band 5.0
You use enough topic vocabulary to communicate the chart’s categories, including “working,” “sleeping,” “travelling to work,” and “relaxing at home.” However, the range is limited and several expressions are repetitive or imprecise, such as “the highest thing,” “the lowest thing,” and “on priority base.” Phrases like “it is 7% found that” also make the intended meaning less natural. These choices sometimes require the reader to interpret what you mean, rather than presenting the data directly. Use more precise chart language, such as “accounted for,” “share,” “rose,” and “fell,” and vary the wording when comparing proportions. This would make the report clearer and more appropriately formal.
Grammatical Range and Accuracy: Band 5.0
The response communicates the basic comparisons, but sentence structures are mostly simple and several attempts at longer sentences are not controlled. For example, “The pie charts illustrates” has subject–verb disagreement, while “If we comparison both 1958 and 2008, than we show” has an incorrect verb form and an unclear clause structure. There are also errors in forms such as “it’s increases” and “this percentage decreases to 25%,” where the intended comparison needs more accurate construction. Repeated sentence openings with “In 1958” limit structural variety. Practise accurate comparative patterns, such as “The figure rose from 33% to 42%,” and combine related information using controlled clauses. Check agreement, verb forms, and punctuation when editing.
See this exact question answered at other band scores. The same prompt compared across bands.
Browse more IELTS Writing model answers or get your own writing scored by the same AI examiner.