Band 5.5 IELTS Writing Task 1 Model Answer
Overall Band Score: 5.5 · Recent IELTS Exams (Canada & India) · 2026-11-06
IELTS Writing Task 1 question
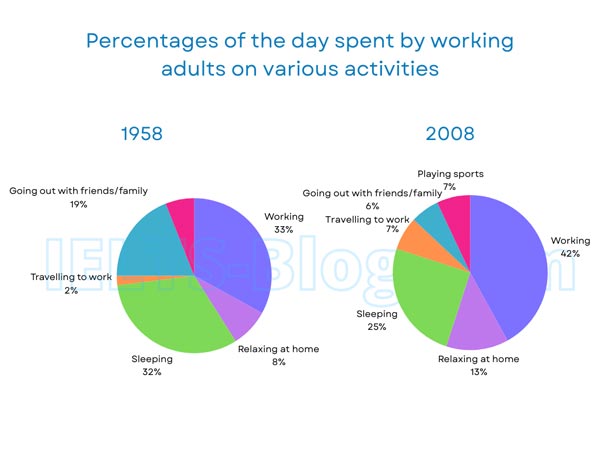
The pie charts below show how working adults in a particular country spent their time in 1958 and 2008.
Summarise the information by selecting and reporting the main features, and make comparisons where relevant.
* Note: these aren’t the original diagrams given in the test, they were recreated for the purpose of demonstration.
Student answer (Band 5.5)
The pie chart illustrate percentage of the adults spent time by workinf various activities from 1958 to 2008.
Intially from 1958 ,a major proportion 33% adults spent time i working.then just 1% decrease and 32% spent their time in sleeping. After that a major fluctuation is shown and 19% spent their time in going out with faimlt and friends,alongside 8% spent their time in relaxing at home.Just 2% prefered travelling to work in 1958.
In 2008,42% of working adults that is greater than 1958.Sleeping adult were25% taht less from previous.but in 2008 7%of playing spot is shown that was not in 1958 adults.But going out with friends and family is gretly decrease from 19% to 6%.Travelling adults increase in and reached to 7%.
a great difference had shown from 1958 to 2008.playing sports is showed in 2008 that was not in 1958.if working percentage increase alongside relaxing at home also increase. sleeping had also decreased in 2008 that had great effect .
AI examiner evaluation
| Criterion | Band |
|---|---|
| Task Achievement / Task Response | 6.0 |
| Coherence and Cohesion | 5.5 |
| Lexical Resource | 5.0 |
| Grammatical Range and Accuracy | 5.0 |
| Overall | 5.5 |
Task Achievement / Task Response: Band 6.0
You report several key figures accurately, including working rising from 33% to 42%, sleeping falling from 32% to 25%, and socialising dropping from 19% to 6%. You also note that sports appears in 2008 and that travel increases. These comparisons address the charts, but the response lacks a clear, concise overview of the main pattern: work becomes the largest share, while sleeping and going out decline. The final paragraph repeats earlier details rather than synthesising them, and the claim that sleeping’s decrease “had great effect” is unclear and unsupported. To strengthen the response, give an overview near the beginning and select the most significant contrasts, while ensuring each comparison is expressed precisely.
Coherence and Cohesion: Band 5.5
The response has a basic chronological structure, first describing 1958 and then 2008, and it uses some linking expressions such as “After that,” “But,” and “alongside.” This gives the reader a general sense of the chart-by-chart progression. However, the final paragraph largely repeats information already given, so the response does not develop towards a clear concluding synthesis. Some links are also awkward or unclear, as in “Travelling adults increase in and reached to 7%,” and the sequence of details within paragraphs can feel like a list. Organise the response into an introduction, a concise overview, and two focused comparison paragraphs; use references and transitions to show how the figures relate.
Lexical Resource: Band 5.0
You use relevant chart vocabulary, including “proportion,” “decrease,” “increase,” and “percentage,” and the reader can generally identify the activities being compared. However, the range is limited and several noticeable spelling and word-choice errors make parts difficult to read, such as “workinf,” “faimlt,” “prefered,” and “playing spot.” Some phrases are also unnatural, including “a major fluctuation is shown” and “Travelling adults increase.” Choose precise verbs and collocations for describing data, and check spelling carefully. For example, describe a category’s share as “accounted for” a percentage, and say that the proportion “rose” or “fell,” rather than describing the adults themselves as increasing.
Grammatical Range and Accuracy: Band 5.0
You attempt both simple statements and longer comparisons, for example, “Sleeping adult were 25%” and “if working percentage increase alongside relaxing at home also increase.” However, sentence structures are often faulty, and errors in agreement, tense, articles, and punctuation sometimes make relationships unclear. The opening, “The pie chart illustrate percentage,” has a singular-subject agreement error and an incomplete noun phrase; later, “that is greater than 1958” compares a percentage with a year rather than with the earlier figure. Commas and spacing are also inconsistently handled. Practise accurate comparison patterns such as “The proportion working rose from 33% to 42%,” and check that each sentence has a clear subject and correctly formed verb.
See this exact question answered at other band scores. The same prompt compared across bands.
Browse more IELTS Writing model answers or get your own writing scored by the same AI examiner.