Band 5.0 IELTS Writing Task 1 Model Answer
Overall Band Score: 5.0 · Recent IELTS Exams (Canada & India) · 2026-11-06
IELTS Writing Task 1 question
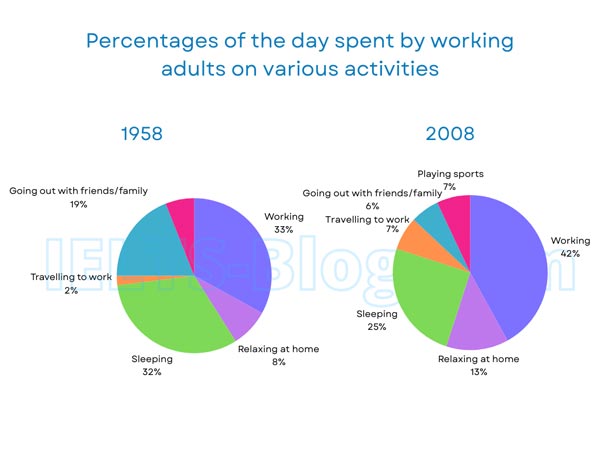
The pie charts below show how working adults in a particular country spent their time in 1958 and 2008.
Summarise the information by selecting and reporting the main features, and make comparisons where relevant.
* Note: these aren’t the original diagrams given in the test, they were recreated for the purpose of demonstration.
Student answer (Band 5.0)
The pie graph demonstartes the two years comparision in specific countries how adolesecents invest spare time in working .
Overall,in various activities youngsters spent time in working are estimated in percentages in 1958 most loved to spend there time in sleeping but 2008 a huge changed most of the people spend there time in working .
However , firstly in 1958 calculating overall percentage the adults spend 33%in working while , in contrast to 2008 most of the adulthood age groups spend time in working almost 42% which seemed a huge change . Furthermore, the secound most spend time 32% in going out with friends and family as compared to 2008 estimated almost 25% in sleeping which was quite less to 1958 .
Afterwords , quite less time in relaxing at home was 8% in contrast ro 2008 travelling and playing sports are same almost 7% while in 1958 very less time in travelling to work was 2%.
Comcluding ,much time in working quite less in travelling in 1958 but in contrast to 2008 much in workinh very les in playing .
AI examiner evaluation
| Criterion | Band |
|---|---|
| Task Achievement / Task Response | 5.0 |
| Coherence and Cohesion | 5.0 |
| Lexical Resource | 4.5 |
| Grammatical Range and Accuracy | 5.0 |
| Overall | 5.0 |
Task Achievement / Task Response: Band 5.0
You identify the broad shift from working adults spending more time on work in 2008 and less on sleep, and you include several relevant figures, such as work rising from 33% to 42% and sleep falling to 25%. However, the account only partially covers the charts and some comparisons are inaccurate: in 1958, 32% was spent sleeping, not going out with friends and family, which was 19%. The overview also says that people “most loved” sleeping, an unclear interpretation rather than a neutral summary of the largest categories. You omit the 2008 figures for going out and relaxing at home, and do not clearly report the new sports category. Select the main changes accurately and compare the same activities across both years.
Coherence and Cohesion: Band 5.0
There is an attempt to organise the response with an opening, an overview, and later details, and transitions such as “Overall,” “Furthermore,” and “in contrast” show an effort to connect information. However, the progression is difficult to follow because categories and years are sometimes mixed together. For example, the sentence beginning “the second most spend time 32%” incorrectly links that figure to going out, while the following comparison shifts to sleeping. Several linking phrases are also used mechanically or do not clarify the relationship between ideas. Group the information into clear paragraphs—for example, an overview followed by comparisons of the main increases and decreases—and use straightforward references to each year and activity.
Lexical Resource: Band 4.5
You attempt a range of vocabulary, including “estimated,” “in contrast,” and “huge change,” but control is limited and errors in spelling, word form, and collocation often make the meaning unclear. Examples include “demonstartes,” “comparision,” “adolesecents,” and “workinh.” Some expressions are unsuitable for describing chart data: “most loved to spend there time” suggests preference, while “adulthood age groups” is not a natural way to refer to working adults. Repeated use of “spend time” and “much” also limits precision. Use standard chart-reporting language such as “accounted for,” “rose,” and “fell,” and check spelling and collocations carefully.
Grammatical Range and Accuracy: Band 5.0
The response attempts longer sentences with contrast clauses, including “while, in contrast to 2008,” but these structures are often faulty, and sentence boundaries and punctuation are inconsistent. For instance, “Overall,in various activities youngsters spent time in working are estimated in percentages” lacks a clear grammatical structure, while “in 1958 calculating overall percentage the adults spend 33%in working” has an unclear opening phrase and awkward tense use. Articles, prepositions, and agreement are also unreliable, as in “spend there time” and “much time in working.” Most sentences require the reader to work out the intended relationships. Build accurate simple sentences first, then add controlled comparisons using patterns such as “Work accounted for 33% in 1958, compared with 42% in 2008.”
See this exact question answered at other band scores. The same prompt compared across bands.
Browse more IELTS Writing model answers or get your own writing scored by the same AI examiner.