Band 5.0 IELTS Writing Task 1 Model Answer
Overall Band Score: 5.0 · Recent IELTS Exams (Canada & India) · 2026-11-06
IELTS Writing Task 1 question
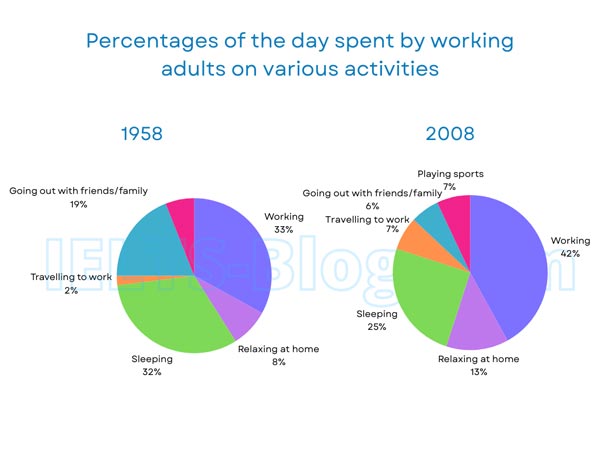
The pie charts below show how working adults in a particular country spent their time in 1958 and 2008.
Summarise the information by selecting and reporting the main features, and make comparisons where relevant.
* Note: these aren’t the original diagrams given in the test, they were recreated for the purpose of demonstration.
Student answer (Band 5.0)
The given pie chart depicts how working adults spent their time in various activities in the years 1958 and 2008. The activities represented are working, relaxing at home, sleeping, travelling to work, going out with friends and family. However most of the time they spent on working and sleeping 33, 32 percent repectively in the year 1958 and 42, 25 persent repectively in the year 2008.
It is apparently noticed that in both centuries 20 and 21, people have spent their huge part of the day at work in 1958, 33% of their time and in 2008, 42% around 9% higher than past. Altough they are spending good amount of time at home for relaxing in 1958 it was 8% and in 2008 it was 13 slight rose. The sleep has been a priority for both generations but the time goes for sleep is around 32% and 25% repectively and the otherds like spending time with family and friends and playing soprts are the least on with 7,7,7 each
AI examiner evaluation
| Criterion | Band |
|---|---|
| Task Achievement / Task Response | 5.0 |
| Coherence and Cohesion | 5.0 |
| Lexical Resource | 5.0 |
| Grammatical Range and Accuracy | 5.0 |
| Overall | 5.0 |
Task Achievement / Task Response: Band 5.0
You identify the two years and report several central figures accurately, including working (33% to 42%), sleeping (32% to 25%) and relaxing at home (8% to 13%). However, the task is only partly covered: travelling to work is not discussed, and the account of social activities and sport is unclear and inaccurate. In 1958, going out with friends and family accounted for 19%, not 7%; in 2008, it was 6%, while travelling and playing sports were each 7%. The response also lacks a clear overview of the main changes across the charts. Select the largest shifts, state them clearly in an overview, and compare the remaining categories using the correct year-specific figures.
Coherence and Cohesion: Band 5.0
There is some organisation: the opening introduces the charts, and the next paragraph discusses several activities. However, the response does not progress clearly from an overview to well-grouped comparisons. The opening sentence after the introduction combines figures without explaining the overall pattern, while the final clause, “the otherds like spending time with family and friends and playing soprts are the least on with 7,7,7 each,” is difficult to follow and does not distinguish the years or categories. Linking words such as “However,” “Although” and “and” are used, but connections between ideas are sometimes unclear. Use a separate overview, then group related comparisons, and make each reference to a figure explicit.
Lexical Resource: Band 5.0
Your vocabulary is sufficient to identify the chart’s subject and activities, with terms such as “working,” “relaxing at home” and “travelling to work.” However, the range is limited, and several choices or collocations are inaccurate or awkward, including “spent their huge part,” “good amount of time,” and “the time goes for sleep.” Spelling errors such as “repectively,” “persent,” “Altough,” “otherds” and “soprts” are noticeable and reduce clarity. Aim for precise, neutral chart language rather than conversational or vague expressions. For example, describe a category as “accounted for” a percentage and say that a figure “rose” or “fell,” checking spelling carefully before submitting.
Grammatical Range and Accuracy: Band 5.0
You attempt both simple and more extended sentences, but control is inconsistent, and errors sometimes make relationships between ideas difficult to understand. For example, “However most of the time they spent on working and sleeping 33, 32 percent respectively” lacks a clear grammatical structure for presenting the figures. In “in 2008, 42% around 9% higher than past,” the comparison is incomplete, and the final sentence runs several ideas together without clear sentence boundaries. There are also problems with articles, verb forms and punctuation, as in “the time goes for sleep.” Build shorter, complete sentences first, then add accurate comparison clauses; use full stops to separate categories and check that each sentence has a clear subject and verb.
See this exact question answered at other band scores. The same prompt compared across bands.
Browse more IELTS Writing model answers or get your own writing scored by the same AI examiner.