Band 5.0 IELTS Writing Task 1 Model Answer
Overall Band Score: 5.0 · Recent IELTS Exams (Canada & India) · 2026-11-06
IELTS Writing Task 1 question
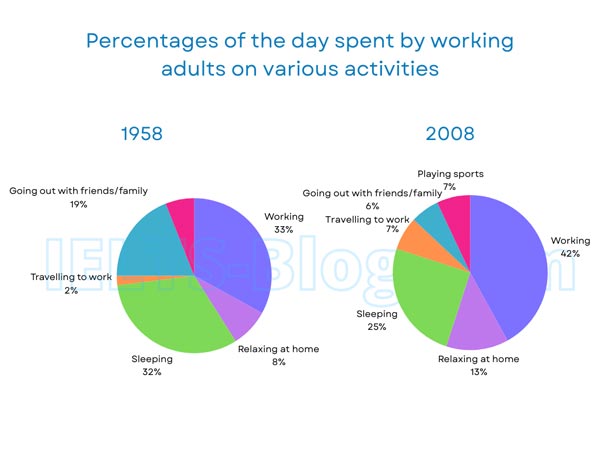
The pie charts below show how working adults in a particular country spent their time in 1958 and 2008.
Summarise the information by selecting and reporting the main features, and make comparisons where relevant.
* Note: these aren’t the original diagrams given in the test, they were recreated for the purpose of demonstration.
Student answer (Band 5.0)
Today, we discuss the lifestyle differences from 1958 to 2008. This topic elaborate how, working adults in a particular country spent their time and the difference between these years. First I want to explain the year 1958. In this year working adults spent their time on various activity is as; 19% people spent their day by going out with friends and family. 33% people spent their day in working all day. 2% spend by travelling to work. 32% spend their time by sleeping. In which the 8% people just relaxing at home.
In second paragraph, I want to elaborate the details in year 2008. 7% use their time by playing sports. In which, 6% just going out with friends and family. 7% are travelling to work. 25% are sleeping in their home. 13% people are relaxing at home and 42% peoples are spending by working only. In 2008 their are so many changes because of the development and time changes.
AI examiner evaluation
| Criterion | Band |
|---|---|
| Task Achievement / Task Response | 5.0 |
| Coherence and Cohesion | 5.5 |
| Lexical Resource | 5.0 |
| Grammatical Range and Accuracy | 5.0 |
| Overall | 5.0 |
Task Achievement / Task Response: Band 5.0
You report most of the chart figures accurately, including the rise in working from 33% to 42%, and the falls in sleeping (32% to 25%) and socialising (19% to 6%). However, the response mainly lists figures year by year rather than selecting and comparing the main features. It lacks a clear overview of the most important changes, and the closing claim that there were “so many changes because of the development” is unsupported by the charts, which show no causes. The 2008 figure for sports is included, but its absence from the 1958 data is not highlighted. To strengthen the response, give an overview first, then compare the largest increases and decreases directly.
Coherence and Cohesion: Band 5.5
The response has a basic two-part structure, with one paragraph for 1958 and another for 2008, and the reader can generally follow the figures. However, the organisation is mostly a sequence of separate details rather than a clear progression from an overview to key comparisons. Phrases such as “First I want to explain” and “In second paragraph” describe the writing process instead of guiding the reader through the data. Repeated sentence openings with percentages also make the account list-like, while “In which” does not connect ideas clearly. Group the years around shared trends—for example, increases in work and commuting versus decreases in sleep and socialising—and use concise linking phrases to show those relationships.
Lexical Resource: Band 5.0
You use relevant basic vocabulary such as “working,” “sleeping,” “travelling to work” and “relaxing at home,” so the activities are usually identifiable. However, the range is limited and several phrases are unnatural or repetitive, including “spent their day by going out,” “spend by travelling,” and “spending by working only.” “This topic elaborate” is also an imprecise way to introduce a chart summary. These choices sometimes make the reader work to understand the intended meaning. Use standard reporting language and accurate collocations, such as “accounted for,” “spent time working,” and “the proportion devoted to.” Avoid adding vague commentary about “development” when the chart provides no explanation of causes.
Grammatical Range and Accuracy: Band 5.0
Most sentences are simple statements, and the response attempts a few longer constructions, but these are often faulty. For example, “This topic elaborate how” has subject–verb agreement and sentence-structure problems, while “In which the 8% people just relaxing at home” is an incomplete clause. There are also recurring errors in verb forms and agreement, as in “2% spend” and “42% peoples are spending.” The tense shifts between past and present, although the charts compare two past years. These errors are frequent enough to make some sentences awkward, even though the figures remain understandable. Practise complete sentences with a consistent past tense, such as “In 1958, adults spent 32% of their day sleeping,” and check agreement and articles.
See this exact question answered at other band scores. The same prompt compared across bands.
Browse more IELTS Writing model answers or get your own writing scored by the same AI examiner.