Band 5.0 IELTS Writing Task 1 Model Answer
Overall Band Score: 5.0 · Recent IELTS Exams (Canada & India) · 2026-11-06
IELTS Writing Task 1 question
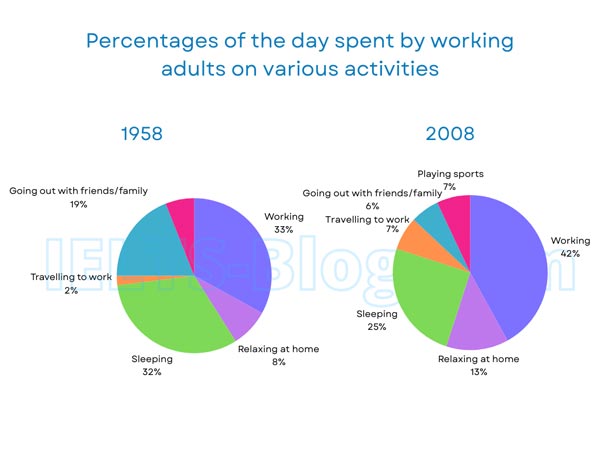
The pie charts below show how working adults in a particular country spent their time in 1958 and 2008.
Summarise the information by selecting and reporting the main features, and make comparisons where relevant.
* Note: these aren’t the original diagrams given in the test, they were recreated for the purpose of demonstration.
Student answer (Band 5.0)
The pie chart demonestrate how working youngers in a particular nation spend thier time in the period between 1958 to 2008.
Overall,it can be seen clearly there are many spending time percentages in both pie charts higher percentages and lower percentages and diffrent activities.
In the begining of 1958 there was mostly adults was spending thier time on working wich was 33%.Although the younger was spending thier on sleep which can 32%.and they were spending 19% time going out with friends or family.however thier relaxing time was just 8% and thier travalling to work is only 2%.
In 2008 their working time percentage increase to 42% and also their sleeping time decrease to 25% but the relaxing time was increase 13%.But in 2008 they are added playing sports and they are spending 7% of thier time it.the big change here is going out with frinds or spending time with family is decrese to 6%. and the travelling to woks time increase to 7% in 2008.
AI examiner evaluation
| Criterion | Band |
|---|---|
| Task Achievement / Task Response | 5.0 |
| Coherence and Cohesion | 5.5 |
| Lexical Resource | 5.0 |
| Grammatical Range and Accuracy | 5.0 |
| Overall | 5.0 |
Task Achievement / Task Response: Band 5.0
You report several key figures accurately, including working rising from 33% to 42%, sleeping falling from 32% to 25%, and socialising dropping from 19% to 6%. You also mention the new sports category and the increase in commuting. However, the overview is too vague: “many spending time percentages” does not identify the main overall changes. The response mainly lists figures rather than selecting and comparing the most important patterns, and the opening incorrectly describes the adults as “working youngers.” To strengthen the report, give a clear overview—for example, work became the largest share, while sleep and socialising declined—and organise the details around these contrasts. This would make the task coverage more complete and the main features clearer.
Coherence and Cohesion: Band 5.5
The response has a basic structure: an introduction, an attempted overview, and separate paragraphs for 1958 and 2008. This gives the reader a general sense of the time sequence, and words such as “Overall,” “Although,” and “however” show an effort to connect ideas. However, progression within sentences is often unclear, as in “Although the younger was spending thier on sleep” and “But in 2008 they are added playing sports.” Several connectors are used inaccurately or mechanically, and the overview does not guide the reader through the comparisons. Grouping related changes together and using clearer links such as “By contrast” or “Meanwhile” would improve the flow and make relationships between figures easier to follow.
Lexical Resource: Band 5.0
You use some relevant vocabulary for describing charts, including “percentage,” “increase,” “decrease,” “sleeping,” and “travelling to work.” The range is nevertheless limited, with repeated use of “spending time” and basic forms of “increase” and “decrease,” so comparisons are not expressed precisely. There are also noticeable spelling and word-choice problems, such as “demonestrate,” “thier,” “diffrent,” “frinds,” and “woks,” as well as the unsuitable phrase “working youngers.” These errors sometimes make the intended meaning harder to understand. Build a small set of accurate chart phrases, such as “accounted for,” “rose to,” “fell to,” and “the proportion devoted to,” and check spelling carefully.
Grammatical Range and Accuracy: Band 5.0
You attempt both simple and more complex sentences, and the reader can usually identify the figures being compared. However, grammatical errors are frequent and sometimes make relationships difficult to follow. For example, “there was mostly adults was spending” has faulty word order and verb structure, while “the relaxing time was increase” uses an incorrect verb form. Agreement and tense are also inconsistent in “they are added playing sports,” and sentence boundaries are often unclear, as in “32%.and they were spending.” Use straightforward, controlled patterns such as “The proportion spent on work rose from 33% to 42%” and “Sleeping fell to 25%.” Check subject–verb agreement, past-tense forms, and punctuation when joining clauses.
See this exact question answered at other band scores. The same prompt compared across bands.
Browse more IELTS Writing model answers or get your own writing scored by the same AI examiner.