Band 4.5 IELTS Writing Task 1 Model Answer
Overall Band Score: 4.5 · Recent IELTS Exams (Canada & India) · 2026-11-06
IELTS Writing Task 1 question
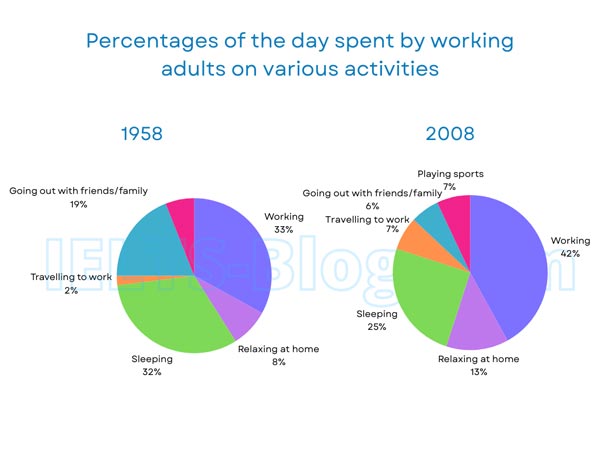
The pie charts below show how working adults in a particular country spent their time in 1958 and 2008.
Summarise the information by selecting and reporting the main features, and make comparisons where relevant.
* Note: these aren’t the original diagrams given in the test, they were recreated for the purpose of demonstration.
Student answer (Band 4.5)
The pai chart depicts the proportion of working activity inhole day of young people in mention country over the last 50 years.
all in all it can be seen that the percentage of working is more than others there for travels for work is the lest over the priod of half century
it can be noticeabl that the increases over whole day. in working hours are rose significantly from 33% to 42% and relaxing at home also increases gragullay over the time1958 to 2008 next the
AI examiner evaluation
| Criterion | Band |
|---|---|
| Task Achievement / Task Response | 4.0 |
| Coherence and Cohesion | 4.0 |
| Lexical Resource | 4.5 |
| Grammatical Range and Accuracy | 4.5 |
| Overall | 4.5 |
Task Achievement / Task Response: Band 4.0
You identify two relevant changes: working rises from 33% to 42%, and relaxing at home increases. However, the response gives only a fragment of the chart’s main picture. It does not report the decreases in sleeping (32% to 25%) and going out with friends or family (19% to 6%), the rise in commuting (2% to 7%), or the appearance of sports at 7% in 2008. The overview that work is the largest category is broadly accurate for 2008, but travel was the smallest category in 1958, while sports and travel are tied for the smallest in 2008. The response is also substantially below the required 150 words. Include a clear overview and compare the main categories across both years.
Coherence and Cohesion: Band 4.0
There is a basic attempt to organise the response, beginning with an introduction and then using “all in all” to signal an overview. The ideas are not developed into a clear sequence, however: the final sentence trails off after “next the,” and there are no distinct paragraphs for the overview and supporting comparisons. Linking expressions such as “there for” and “over the time” do not clearly connect the information, while the repeated references to increases leave the reader without a complete account of the chart. To improve, use a short introduction, a separate overview, and one or two paragraphs grouping the main changes, with clear links such as “by contrast” and “whereas.”
Lexical Resource: Band 4.5
The response uses a few relevant terms, including “percentage,” “working hours,” “relaxing at home,” and “increases,” so the topic is recognisable. However, the vocabulary is basic and several spelling or word-choice errors make the meaning less clear, including “pai chart,” “in hole day,” “lest,” and “gragullay.” Some phrases are also unnatural for describing a chart: “working activity” and “travels for work” would be better expressed as “time spent working” and “commuting.” Build a small set of accurate chart-reporting expressions, such as “accounted for,” “rose from…to…,” and “fell considerably,” and check spelling before submitting.
Grammatical Range and Accuracy: Band 4.5
There is an attempt to form longer sentences and use comparison over time, but grammatical control is inconsistent and the range remains limited. For example, “the increases over whole day. in working hours are rose significantly” has an incomplete opening clause, an unnecessary sentence break, and an incorrect verb construction; “are rose” should be “rose” or “increased.” The opening sentence also lacks a clear grammatical structure, and the final phrase “next the” is unfinished. Punctuation and spacing make sentence boundaries difficult to follow. Practise complete subject–verb sentences and accurate past-tense reporting, for example, “The proportion of time spent working rose from 33% in 1958 to 42% in 2008.”
See this exact question answered at other band scores. The same prompt compared across bands.
Browse more IELTS Writing model answers or get your own writing scored by the same AI examiner.