Band 4.5 IELTS Writing Task 1 Model Answer
Overall Band Score: 4.5 · IELTS Predictions Nov 2026 · 2026-11-16
IELTS Writing Task 1 question
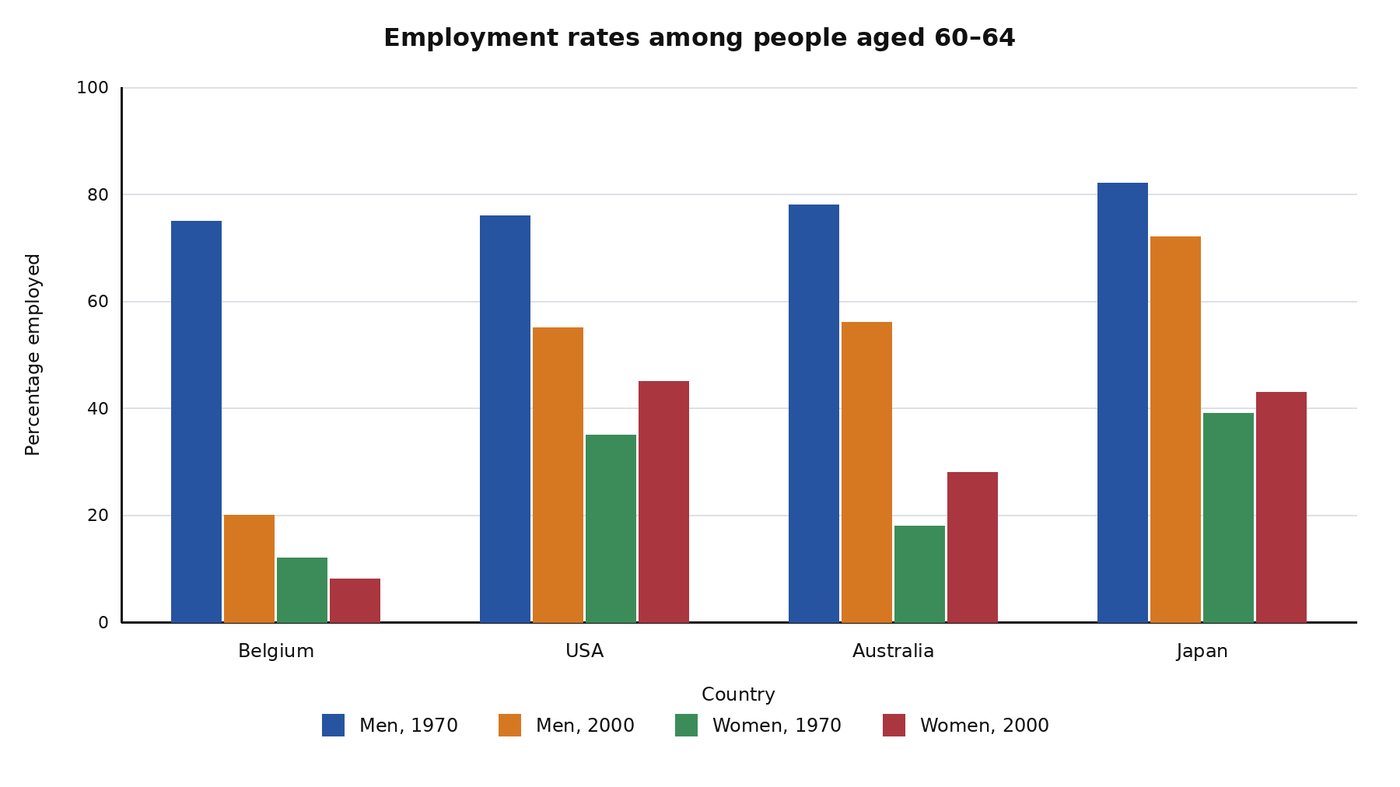
The bar chart below compares the percentages of men and women aged 60–64 who were employed in Belgium, the USA, Australia and Japan in 1970 and 2000.
Summarise the information by selecting and reporting the main features, and make comparisons where relevant.
Student answer (Band 4.5)
The bar chart shows the percentages of men and women aged 60–64 who were employed in Belgium, the USA, Australia and Japan in 1970 and 2000.
Overall, the men in 1970 had larger amount of employment rates, while the women in 1970 had smaller number of employment rates in four countries. In 2000 men had moderate employed but in japan had larger job rates with compared to others country.
In Belgium, the men in 1970 had 78% employed, while the women had 7% in 2000.In addition, in USA women in1970 had 37%, while the men and women had almost same percentage. And the last category men,1970 had same employment rates lik Belgium.
In contrast, Men,1970 accounted had same employment rates which is approximately 80% in Australia and Japan. The men,2000 were more employed in Japan compared to Australia. Moreover, the other two categories accounted employed rate was lower than 40% expect to women,2000 which is 42%.
AI examiner evaluation
| Criterion | Band |
|---|---|
| Task Achievement / Task Response | 4.0 |
| Coherence and Cohesion | 4.5 |
| Lexical Resource | 5.0 |
| Grammatical Range and Accuracy | 5.0 |
| Overall | 4.5 |
Task Achievement / Task Response: Band 4.0
You identify the chart’s subject and make an attempt at an overview, noting that men’s employment was generally higher and that Japan had relatively high rates in 2000. However, the overview is unclear and some comparisons are inaccurate or unsupported. For example, Belgium’s male rate in 1970 was about 75%, not 78%, and the statement that US men and women had “almost same percentage” does not specify a year; in 2000 their rates were 55% and 45%. Several key trends are missed, including the sharp fall in men’s rates from 1970 to 2000 and the rise in women’s rates in the USA, Australia and Japan. The response is also below the 150-word minimum: 134 words, with 23 prompt words excluded. Develop a clear overview and report accurate, selected comparisons.
Coherence and Cohesion: Band 4.5
The response has a basic paragraph structure: an introduction, an overview, and two paragraphs of country details. Linking expressions such as “Overall,” “In addition,” and “In contrast” show an attempt to connect ideas. However, the progression is difficult to follow because the country comparisons are mixed together and some references are unclear. For instance, “the last category” and “the other two categories” do not make clear which data series you mean, while the sentence about the USA combines women’s 1970 figure with an unspecified comparison of men and women. Organise the details by a consistent pattern—such as comparing men and women across the years—and name the year and group in each comparison. This would make the relationships between figures clearer and reduce the need for the reader to infer your meaning.
Lexical Resource: Band 5.0
You use relevant basic terms such as “percentages,” “employed,” “employment rates,” and “compared,” so the topic is generally recognisable. However, the range is limited and several word combinations are unnatural or imprecise, including “larger amount of employment rates,” “moderate employed,” and “larger job rates.” These choices make some comparisons harder to understand and do not describe the data precisely. There are also inconsistent forms and spelling, such as “japan” and “lik,” and phrases such as “accounted employed rate” are not idiomatic. Build a small set of accurate chart-reporting expressions, for example “employment rate,” “was higher than,” “fell to,” and “rose from … to ….” Use “rate” consistently rather than switching to “job rates” or “amount.”
Grammatical Range and Accuracy: Band 5.0
You produce several simple sentences and attempt longer structures with “while,” “in addition,” and “which,” but the range is limited and errors occur frequently. Examples include “the men in 1970 had larger amount,” where the article and sentence structure are faulty, and “the men,2000 were more employed,” which has an awkward construction. The sentence beginning “In addition, in USA women in1970 had 37%” also lacks clear grammatical framing, and punctuation spacing is inconsistent, as in “2000.In addition.” These problems sometimes obscure which year or group a figure refers to. Practise forming complete comparison sentences with a clear subject and verb, such as “In 2000, the rate for men was higher than that for women in the USA.” Check articles, prepositions, commas, and spacing when editing.
See this exact question answered at other band scores. The same prompt compared across bands.
Browse more IELTS Writing model answers or get your own writing scored by the same AI examiner.