Band 5.5 IELTS Writing Task 1 Model Answer
Overall Band Score: 5.5 · IELTS Predictions Nov 2026 · 2026-11-09
IELTS Writing Task 1 question
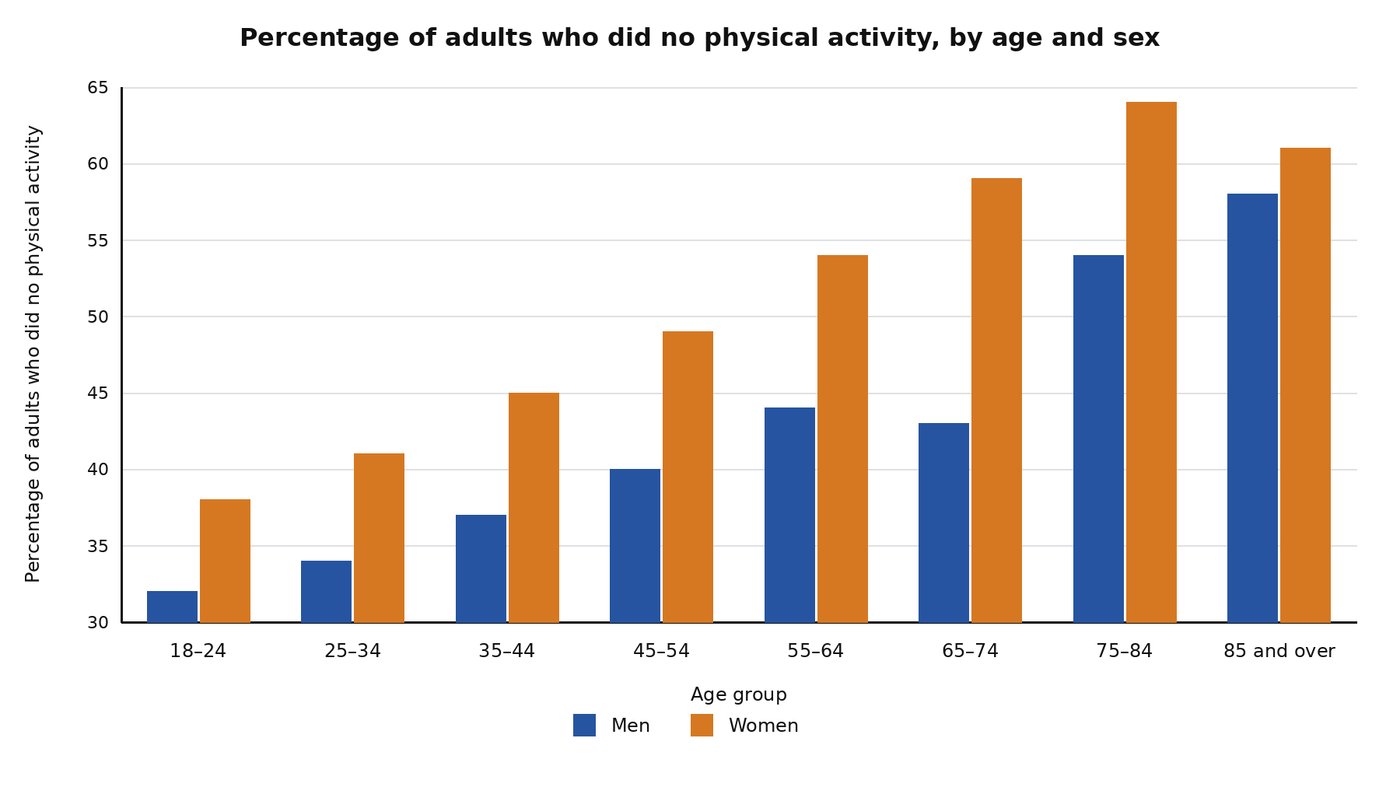
The bar chart below compares inactivity rates across age groups and between the sexes among adults in Australia in 2005.
Summarise the information by selecting and reporting the main features, and make comparisons where relevant.
Student answer (Band 5.5)
The bar chart below illustrates the inactivity rates across age groups and between the genders among adults in Australia in 2005. Overall, the inactivity rates in women is more common then men, men have lower inactivity rates then women as men are more productive and more active.
The bar chart describes that in 2005 32% men did no physical activity at the age from 18-24, while women have higher proportion, about 37% at the age from 18-24. The percentage of both genders for not doing any physical activity rises with the growing age and with the passage of time. At 25-34 the percentage rose to 34% for men and 41% for women, at 35-44 the percentage rose up to 37% for men and 45% women, at 45-54 the percentage rose up to 40% for men and 49% for women, at 55-64 the percentage rose up to 44% for men and 54% for women, at the age from 65-74 the percentage decrease to 46% for males and increase up to 59% for females, at the age from 75-84 the bar for males rises sharply up to 54% and for females the bar rise up to 64%, at the from 85 and over the percentage rose up to 57% for males and decreases up to 61% for females.
AI examiner evaluation
| Criterion | Band |
|---|---|
| Task Achievement / Task Response | 5.5 |
| Coherence and Cohesion | 5.5 |
| Lexical Resource | 5.5 |
| Grammatical Range and Accuracy | 5.0 |
| Overall | 5.5 |
Task Achievement / Task Response: Band 5.5
You identify the chart’s subject and give an overview that women generally had higher inactivity rates than men. You also report figures across all age groups, so the main series are covered. However, some details are inaccurate: women aged 18–24 are shown at about 38%, not 37%; men aged 65–74 are about 43%, not 46%; and the oldest men are about 58%, rather than 57%. The overview also adds an unsupported explanation that men are “more productive,” which the chart cannot establish. The description that rates rise with age needs qualification: men’s rate dips slightly from 44% to 43% at 65–74, while women’s rate falls after peaking at 64%. Focus the overview on these patterns and avoid causal claims.
Coherence and Cohesion: Band 5.5
The response has a recognisable structure: an introduction and overview are followed by a chronological account of the age groups. This makes the data broadly easy to locate. However, the body is largely one long sequence of figures joined by repeated phrases such as “at the age” and “the percentage rose up to,” so the progression feels mechanical rather than clearly organised around comparisons. Some transitions also misrepresent the trend, particularly where the account says both genders’ rates rise with age despite the small male dip and the final female decline. Grouping the data into younger and older age ranges, and explicitly contrasting the two sexes, would create clearer progression and more effective cohesion.
Lexical Resource: Band 5.5
You use relevant chart vocabulary, including “inactivity rates,” “proportion,” “percentage,” and “rises sharply,” and the reader can generally understand the comparisons. However, the range is limited by repeated use of “percentage,” “bar,” and “rose up to.” Several choices are inaccurate or unnatural for describing the data: “more common” does not precisely describe a rate, and “the passage of time” suggests a time series, whereas the chart compares age groups in one year. “Productive” is also an unsupported and unsuitable interpretation. Use precise reporting verbs and terms such as “stood at,” “increased,” “declined,” and “was higher than,” while varying the language without changing the chart’s meaning.
Grammatical Range and Accuracy: Band 5.0
The response attempts both simple and longer sentences, and the sequence of figures is usually understandable. However, errors are frequent and sometimes make relationships between subjects and figures less clear. For example, “the inactivity rates in women is” has subject–verb disagreement, while “32% men did no physical activity” is missing a necessary grammatical link. Comparisons also contain faulty forms, as in “higher proportion” and “the percentage decrease to 46%”; the latter should use a past-tense verb and the correct figure. The long final sentence chains several clauses together, with inconsistent verb forms such as “the bar rise.” Practise accurate past-tense reporting and agreement, and divide the data into shorter, controlled sentences.
See this exact question answered at other band scores. The same prompt compared across bands.
Browse more IELTS Writing model answers or get your own writing scored by the same AI examiner.