Band 6.5 IELTS Writing Task 1 Model Answer
Overall Band Score: 6.5 · IELTS Predictions Nov 2026 · 2026-11-10
IELTS Writing Task 1 question
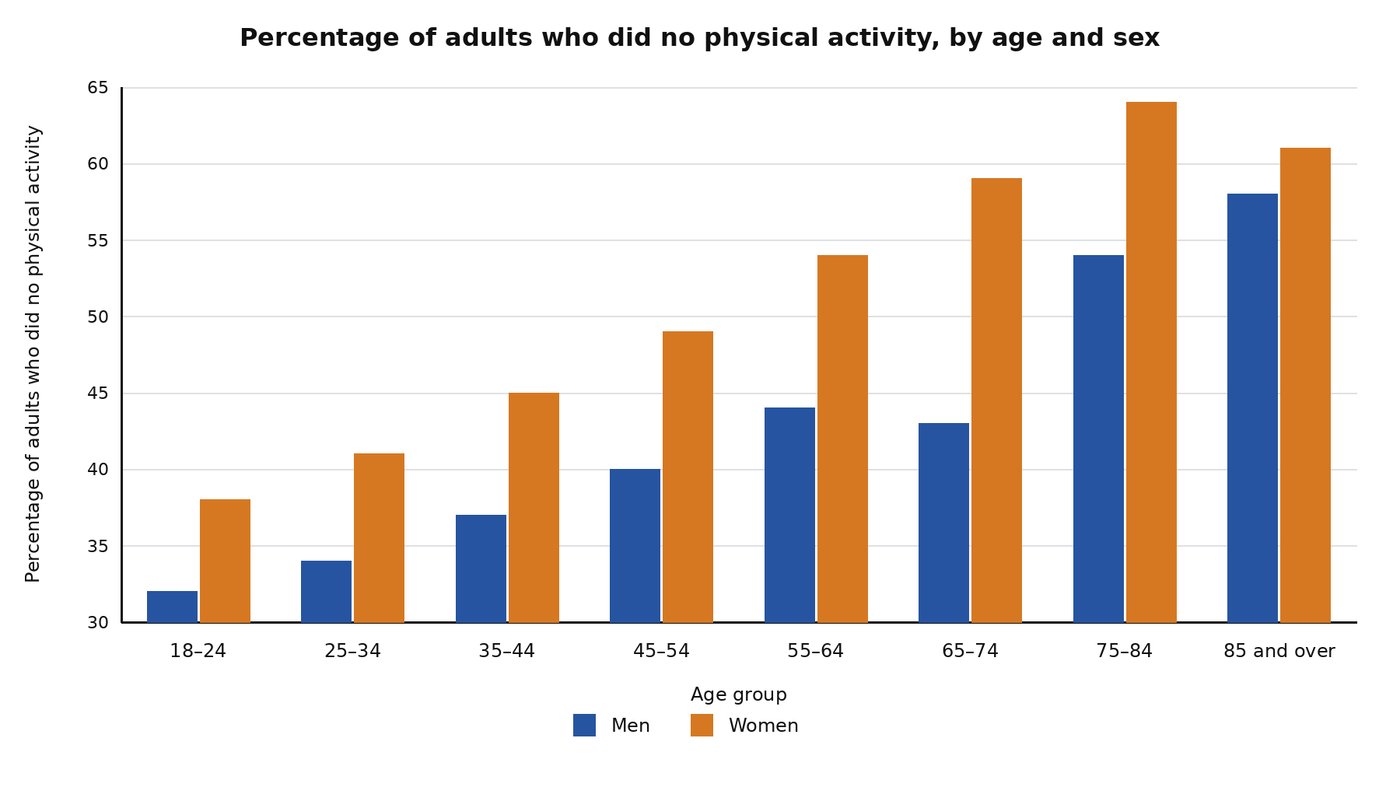
The bar chart below compares inactivity rates across age groups and between the sexes among adults in Australia in 2005.
Summarise the information by selecting and reporting the main features, and make comparisons where relevant.
Student answer (Band 6.5)
The bar chart illustrates the percentage of Australian adults who did no physical activity in 2005. The chart separates men and women into age groups ranging from 18-24 to 85 and over. Overall, the percentage of inactive women was higher than men across all ages and the percentage of inactivity for both gender increases in with age.
Among adults aged 18-24, around 32% men did no physical activity, compared with 38% of women. In the 25-34 age group, the percentage were higher, at 34% men and 41 % women. Among those aged 35-44, 35 % men were inactive, compared with 45 % of women. The figure for adults aged 45-54 were higher again, with 40% men and 49 % women doing no physical activity.
In the age group 55-64, inactivity rate were higher than the younger group, with 44% of men and 54% of women inactive. Among those aged 65-74, the inactive rate for men slightly lower, at 43 % , while women’s rate was higher with 59%. In the next age group, 75-84, the rate were higher for both sexes, with 54 % of men and 64% of women doing no physical activity. In last age group, 85 and over, the men inactive rate was the highest at 58 % , while the for women rate was lower than the previous at 62%.
AI examiner evaluation
| Criterion | Band |
|---|---|
| Task Achievement / Task Response | 6.5 |
| Coherence and Cohesion | 7.0 |
| Lexical Resource | 6.5 |
| Grammatical Range and Accuracy | 6.0 |
| Overall | 6.5 |
Task Achievement / Task Response: Band 6.5
You give a clear overview of the main pattern: women had higher inactivity rates in every age group, and rates generally rose with age. Most figures are reported accurately, and you note the small dip for men at 65–74 and the decline for women in the oldest group. However, there are two data inaccuracies: men aged 35–44 are shown at 37%, not 35%, and women aged 85 and over are at about 61%, not 62%. The overview could also be more precise by noting that women’s rate peaks at 75–84 before falling, while men’s reaches its highest point in the oldest group. This covers the task well, though some key details and comparisons could be developed more fully.
Coherence and Cohesion: Band 7.0
The response is organised clearly, moving from an introduction and overview to a chronological account of the age groups. This makes the information easy to follow, and phrases such as “In the next age group” and “Among those aged 65–74” help signal progression. The paragraphing is appropriate, and the overview is placed where readers expect it. However, the body is largely a sequence of individual figures, so comparisons between the sexes and the contrasting patterns in the oldest groups could be linked more flexibly. Some transitions, including repeated uses of “Among” and “In the age group,” feel formulaic. Grouping several age bands together and using clearer contrast markers would make the progression more analytical and less list-like.
Lexical Resource: Band 6.5
You use an adequate range of task-relevant vocabulary, including “inactive,” “inactivity rate,” “compared with,” and “slightly lower,” and the meaning remains clear throughout. There is some variation in how you describe the data, rather than relying on one term alone. However, several collocations and forms are awkward, such as “the men inactive rate,” “the for women rate,” and “the percentage of inactivity for both gender.” These reduce naturalness and precision. Use standard chart language such as “the rate among men,” “the figure for women,” and “inactivity rates for both sexes.” More precise verbs such as “rose,” “peaked,” and “declined” would also help you describe the trends efficiently.
Grammatical Range and Accuracy: Band 6.0
You attempt both simple and more complex sentence forms, including comparisons with “compared with” and clauses introduced by “while.” Most sentences communicate the intended figures, and the overall meaning is not difficult to follow. Some grammatical errors remain, particularly with subject–verb agreement and sentence construction: “the percentage were higher,” “the figure … were higher again,” and “the percentage … increases in with age.” There are also problems with noun phrases, as in “32% men” rather than “32% of men,” and the final clause “while the for women rate was lower” is structurally faulty. Check agreement, use “of” in percentage expressions, and proofread each sentence for a complete, correctly ordered noun phrase.
See this exact question answered at other band scores. The same prompt compared across bands.
Browse more IELTS Writing model answers or get your own writing scored by the same AI examiner.