Band 5.5 IELTS Writing Task 1 Model Answer
Overall Band Score: 5.5 · IELTS Predictions Nov 2026 · 2026-11-11
IELTS Writing Task 1 question
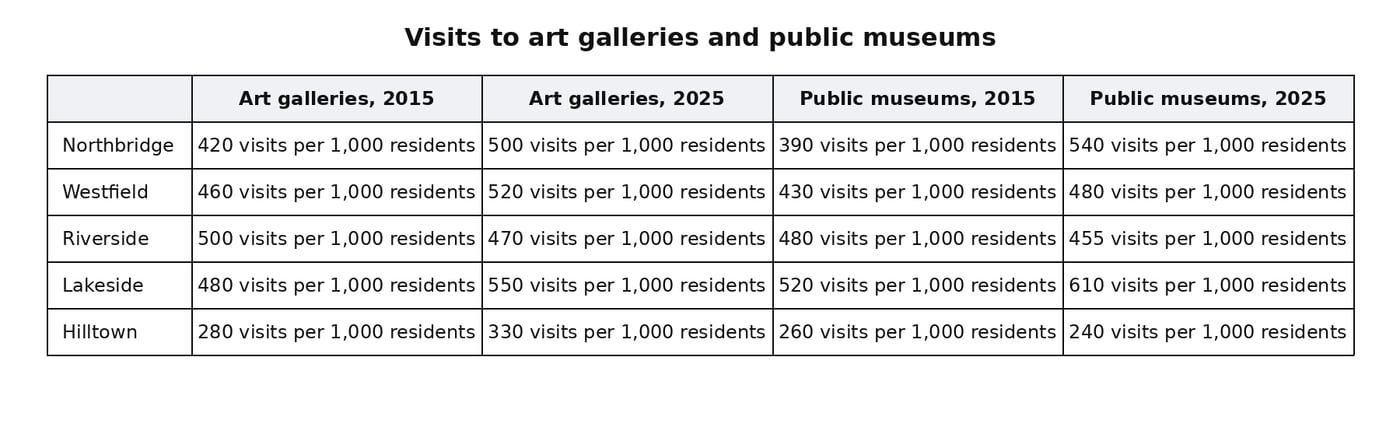
The table below shows visits to art galleries and public museums per 1,000 people in five towns in 2015 and 2025.
Summarise the information by selecting and reporting the main features, and make comparisons where relevant.
Student answer (Band 5.5)
This chart illustrates that per one thousand individuals visited in art gallery and public museum in 2015 and 2025 .
Overall , it can be seen that lakeside showed more intreset in public museum between 2015 and 2025.moreover in the same town the number of visiter for art gallery also highest in number 2025 .whereas ,hilltown showed least visitor interest in both places between following years .
In art gallery, the number of visitors per 1000 residence increase in all town from 215 to 2025 except in Riverside,that showed lowest number as compared to other cities which are 470 visitors.Northbrige and Westfield showed almost similiar trend which are 420 and 460 people in 2015 and increased from 420 to 500 in northbridge and 520 in westfield in year 2025.Furthermore, only 50 persons increase in hilltown between these years in art gallery.apart from that in public museum the number of vistior in Westfield riverside and lakeside are almost similar in 2015 and increase in 2025 .but in Riverside the 25 people decease in 2025.
as well as hilltown also showed slightly decline in number of people in 2025 these are from 260 to 240 visitors in 2025.A notable increase in numbers in the lakeside in the public museum can be seen in 2025 that are 610 visitors that are highest in figure as compare to the others .
AI examiner evaluation
| Criterion | Band |
|---|---|
| Task Achievement / Task Response | 6.0 |
| Coherence and Cohesion | 5.5 |
| Lexical Resource | 5.5 |
| Grammatical Range and Accuracy | 5.0 |
| Overall | 5.5 |
Task Achievement / Task Response: Band 6.0
You identify several important features, including Lakeside’s leading museum figure in 2025 (610) and Hilltown’s low figures, and you note the decline in Riverside’s gallery visits and museum visits. These observations show a relevant response to the table. However, some comparisons are inaccurate or unclear: gallery visits did not increase in every town, since Riverside fell from 500 to 470, and Lakeside—not Riverside—had the highest gallery figure in 2025, at 550. The overview also says Lakeside had the greatest interest in museums across both years, although Westfield was not the lowest and the comparison is not fully specified. Select the main overall patterns more precisely, then support them with accurate figures for both categories and years.
Coherence and Cohesion: Band 5.5
The response has a recognisable structure: an opening, an overview, and discussion of galleries followed by museums. This gives the reader a basic route through the information. However, progression within the body is difficult to follow because several towns and figures are packed into long sentences, and transitions such as “apart from that” and “as well as” do not always show the relationship between points clearly. The statement that Westfield, Riverside and Lakeside are “almost similar” is also hard to interpret without specifying which figures are being compared. Use separate, focused sentences and organise comparisons consistently—for example, report the gallery pattern first, then the museum pattern, with clear links between each town’s 2015 and 2025 values.
Lexical Resource: Band 5.5
You use relevant task vocabulary such as “increase,” “decline,” “highest,” and “visitors,” and you attempt to describe comparisons rather than simply list figures. However, word choice and spelling errors are noticeable, including “intreset,” “visiter,” “similiar,” and “decease.” Some phrases are also unnatural or imprecise, such as “showed more interest” and “highest in figure”; the table reports visit rates, not people’s interest. Repetition of “number of visitors” limits flexibility. Aim for accurate collocations such as “the number of visits rose” and “recorded the highest rate,” and check spelling and word forms carefully. This would make the comparisons clearer and more appropriate to an academic report.
Grammatical Range and Accuracy: Band 5.0
You attempt both simple and more complex sentences, including clauses introduced by “whereas” and “which,” and the reader can generally understand the intended comparisons. However, errors in sentence construction and control are frequent enough to make some passages difficult to read. For example, “the number of visitors … increase” needs subject–verb agreement and past tense (“increased”), while “the 25 people decease” has an incorrect verb form and an incomplete construction. Several sentences run together without appropriate full stops, and spacing around punctuation is inconsistent. Practise writing shorter, complete sentences with a clear subject and verb, and use past-tense forms consistently when describing the 2015–2025 changes.
See this exact question answered at other band scores. The same prompt compared across bands.
Browse more IELTS Writing model answers or get your own writing scored by the same AI examiner.