Band 5.0 IELTS Writing Task 1 Model Answer
Overall Band Score: 5.0 · IELTS Last Minute Nov 2026 · 2026-11-19
IELTS Writing Task 1 question
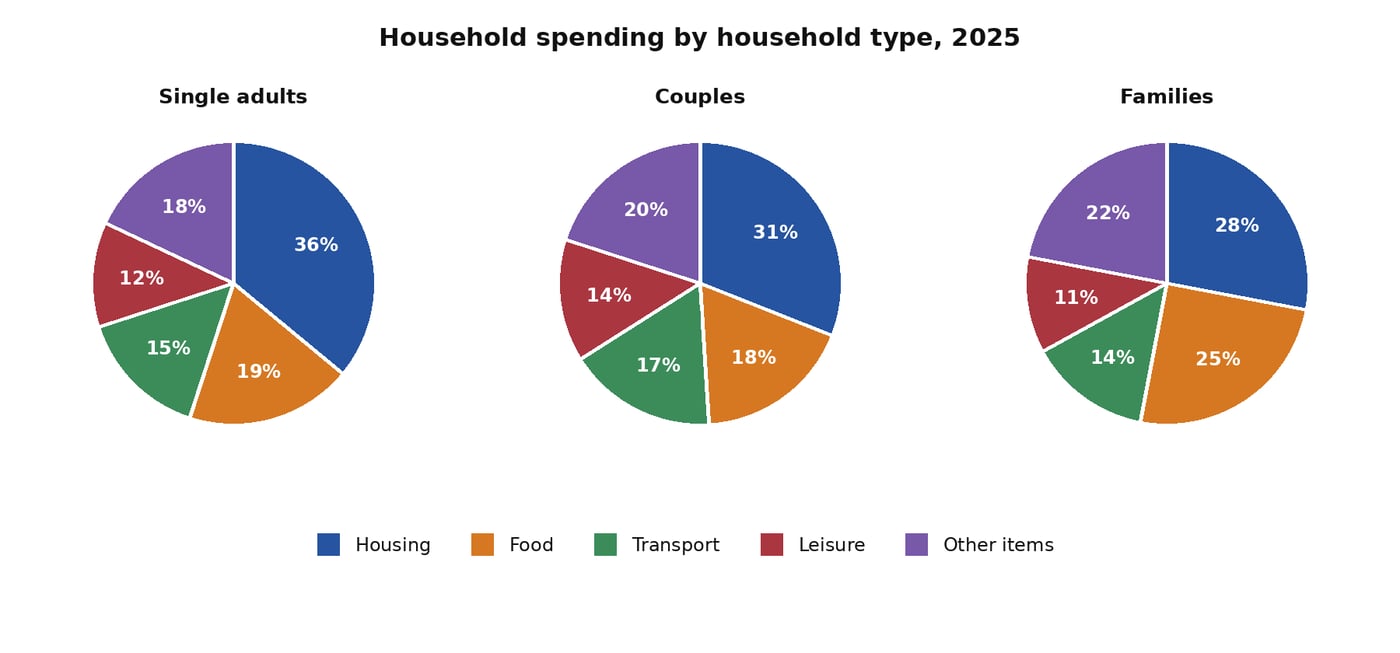
The pie charts below compare how single adults, couples and families in one country allocated their household spending across five categories in 2025.
Summarise the information by selecting and reporting the main features, and make comparisons where relevant.
Student answer (Band 5.0)
The pie chart illustrates the comparison on how single adults, couples and families in a country allocates there household budget in five categories in the year 2025.
Overall, all group categories gives their largest amount of budget in housing while they give their lowest speanding allocation in leisure things.
Housing allocation has the largest budget in all three group categories with over 30 percent of their total household spending. It varies the second priority where family group allocates their
AI examiner evaluation
| Criterion | Band |
|---|---|
| Task Achievement / Task Response | 4.0 |
| Coherence and Cohesion | 4.5 |
| Lexical Resource | 5.5 |
| Grammatical Range and Accuracy | 5.0 |
| Overall | 5.0 |
Task Achievement / Task Response: Band 4.0
You identify the chart’s subject and give a relevant overview: housing takes the largest share for all three household types, while leisure is the smallest. However, the response is incomplete and reports very little supporting data. It stops mid-sentence at “family group allocates their”, so the comparison about the second priority is not explained, and none of the chart’s percentages are accurately presented in the body. The task requires at least 150 words, and this response is substantially below that minimum. To develop the report, complete the comparisons and include key figures—for example, housing falls from 36% for single adults to 28% for families, while families spend 25% on food, the highest figure in that category.
Coherence and Cohesion: Band 4.5
There is a basic structure: an introduction is followed by an overview and the start of a detail paragraph. The overview also gives the reader a clear central comparison. However, the response has no completed progression beyond this point: the final sentence breaks off after “allocates their”, leaving the intended idea unclear and preventing a full comparison of the groups. Connections between details are therefore very limited, and the paragraphing does not yet organise a complete report. Build the body around clear comparisons, such as housing and food first, then the remaining categories, and use linking phrases such as “by contrast” or “whereas” to show how the figures relate.
Lexical Resource: Band 5.5
You use some relevant vocabulary for describing the chart, including “illustrates”, “household budget”, “categories” and “allocation”. This gives the response a recognisable report style, but the range is limited and several choices are inaccurate or awkward, such as “comparison on how” and “leisure things”. There are also spelling errors in “speanding” and “there”, which reduce precision. Aim for standard chart language and accurate category names: “compares spending across”, “leisure”, and “share of household expenditure” would be more natural. Using precise terms for proportions and categories would also help you report the data clearly.
Grammatical Range and Accuracy: Band 5.0
The response attempts a few sentence forms, including an overview beginning with “Overall” and a longer sentence about housing. However, control is inconsistent. In the opening, the plural subjects “single adults, couples and families” do not agree with “allocates”; “their household budget” is also needed rather than “there household budget”. Similarly, “all group categories gives” has a subject–verb agreement error, and “It varies the second priority where…” is not a complete, clear grammatical construction. The final sentence is unfinished, so its structure cannot be followed. Practise accurate agreement and complete comparative clauses, for example: “Families allocate the largest share to housing, whereas single adults spend more on housing than the other groups.”
See this exact question answered at other band scores. The same prompt compared across bands.
Browse more IELTS Writing model answers or get your own writing scored by the same AI examiner.