Band 5.5 IELTS Writing Task 1 Model Answer
Overall Band Score: 5.5 · IELTS Last Minute Nov 2026 · 2026-11-19
IELTS Writing Task 1 question
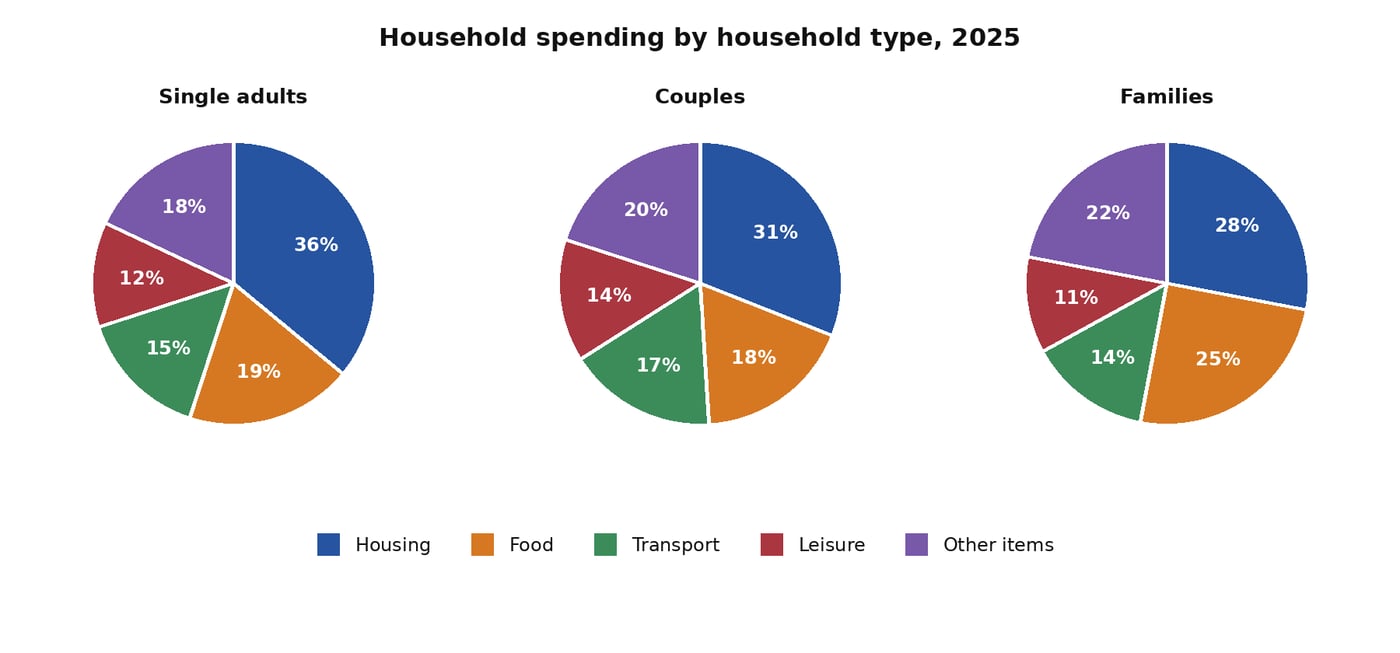
The pie charts below compare how single adults, couples and families in one country allocated their household spending across five categories in 2025.
Summarise the information by selecting and reporting the main features, and make comparisons where relevant.
Student answer (Band 5.5)
The pie charts compare how single adults, couples and families in one country allocated their household spending across five categories in 2025.
Looking at the chart, it is clear that overall, single people spend more money on housing then couples and families. Families pay more money for other items than couples and single adults. Couples pay more income on leisure then other ones. All the household spend average amount of money on transport and food. But families spent more for food then others.
Initially, single adults pay 36% money on housing but couple spend 31% and families spend 28% for housing. For food famillies pay more then other about 25% but couples pay 18% and single person pay about 19%. For transport familierspend 14% but couples spend 17% and single people spend 15%.
Families spend 22% for other items but couples spend slightly less about 20% and single spend 18% for other items. For leisure families pay 11% but couples pay 14% and single adults spend 12% on leisure.
AI examiner evaluation
| Criterion | Band |
|---|---|
| Task Achievement / Task Response | 6.5 |
| Coherence and Cohesion | 5.5 |
| Lexical Resource | 5.0 |
| Grammatical Range and Accuracy | 5.0 |
| Overall | 5.5 |
Task Achievement / Task Response: Band 6.5
You cover all five categories and report the figures accurately, including the highest housing share for single adults (36%), the highest food share for families (25%), and the highest leisure share for couples (14%). Your overview identifies several useful contrasts, and the response shows some selection of key features rather than merely listing figures. However, the overview is not fully precise: “All the household spend average amount of money on transport and food” is unclear and does not accurately summarise the differences between these categories. The comparison that couples spend more on leisure than the other groups is relevant, but could be expressed more clearly. To strengthen the response, make the main patterns explicit and compare the largest and smallest shares across household types.
Coherence and Cohesion: Band 5.5
The response has a recognisable structure: an introduction, an overview, and a paragraph reporting figures. The information is generally grouped by category, so readers can follow the comparisons. However, progression is limited because the body largely repeats the same pattern of listing each group’s percentage, and linking words such as “but” and “For” are used mechanically. The overview also moves quickly between housing, other items, leisure, transport and food without a clear organising principle. Some phrasing, particularly “All the household spend average amount of money on transport and food,” makes the relationship between ideas difficult to follow. Group the main comparisons more deliberately and use clearer links to show contrasts and similarities.
Lexical Resource: Band 5.0
You use relevant topic vocabulary, including “allocated,” “household spending,” “categories,” and the names of all five spending areas. This is enough to communicate the chart’s subject and most comparisons. However, the range is limited and several expressions are unnatural or imprecise, such as “pay more money on housing,” “pay more income on leisure,” and “spend 36% money.” Repeated use of “pay” and “spend” also makes the report sound repetitive. There are spelling errors, including “famillies” and “familierspend,” which reduce accuracy. Aim for more precise chart language, such as “accounted for,” “share,” and “percentage,” and check spelling carefully.
Grammatical Range and Accuracy: Band 5.0
You use mostly simple sentence patterns, with some attempts to combine comparisons using “but” and “than.” The meaning of most individual figures remains understandable, but grammatical errors occur throughout and sometimes make relationships unclear. For example, “All the household spend average amount of money” has problems with subject–verb agreement and sentence construction, while “single adults pay 36% money” is missing a grammatical link between the percentage and the category. Comparisons such as “families pay more … then other” also need a correctly formed comparative structure. Practise accurate patterns such as “Families spent a larger share on food than the other groups” and vary these with well-controlled complex sentences.
See this exact question answered at other band scores. The same prompt compared across bands.
Browse more IELTS Writing model answers or get your own writing scored by the same AI examiner.