Band 5.5 IELTS Writing Task 1 Model Answer
Overall Band Score: 5.5 · IELTS Last Minute Nov 2026 · 2026-11-22
IELTS Writing Task 1 question
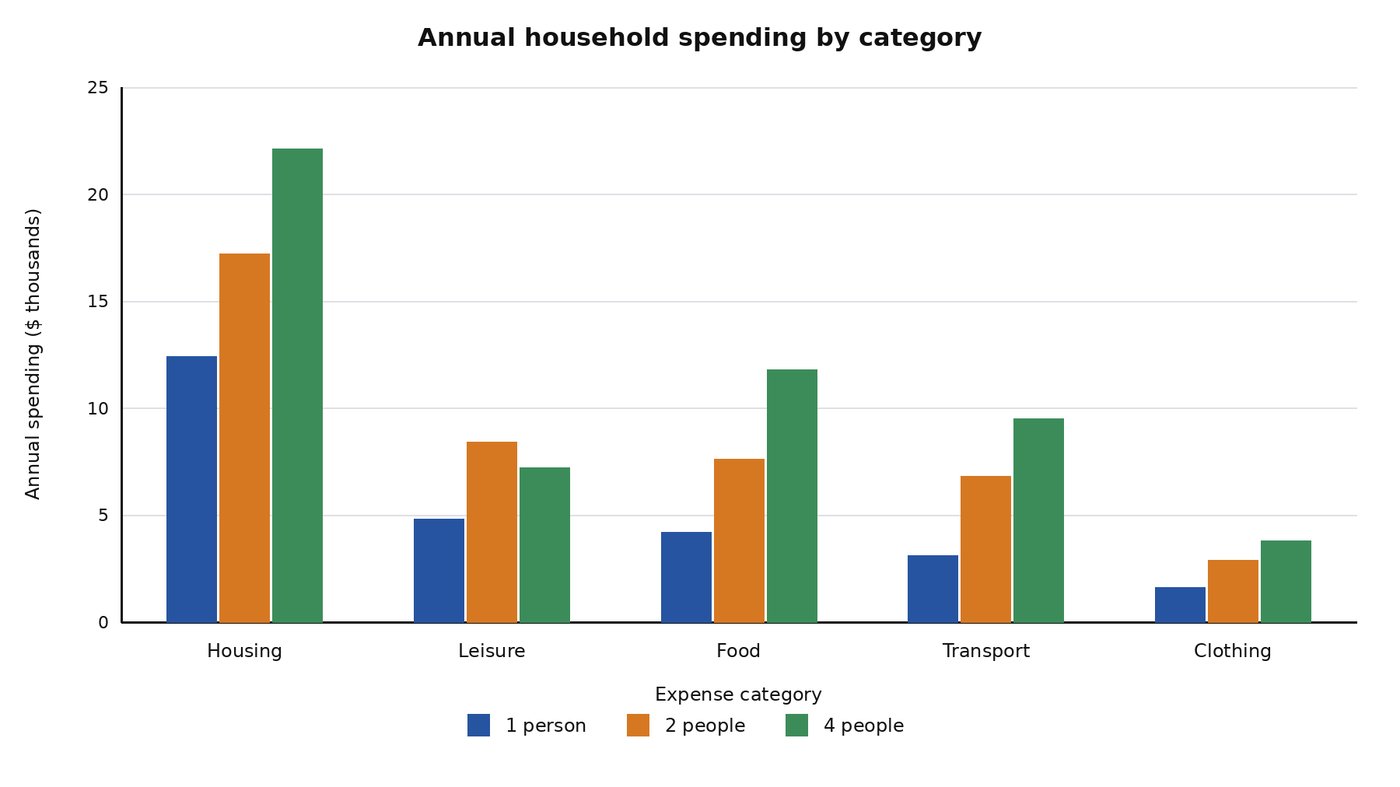
The chart below shows annual spending by households of three different sizes on five categories in one country.
Summarise the information by selecting and reporting the main features, and make comparisons where relevant.
Student answer (Band 5.5)
The bar graph illustrates annual spending by households of three different sizes on housing, lesiure, fppd, transport and clothing in one country.
Overall, it is clearly noticeable by the by the chart that housing is in the highest peak whereas clothing is the least use by families of three different sizes in five categories.
A glance at the chart reveals that, housing is in the top . However it is more use by 4 people at 22000 which was high as compare to 2 differet sizes. Moreover, 2 people and 1 person spend 17000 and 13000 in housing respectively. Food is the second priority for nuclear family at 11000 after that they spend 9000 in transport. Furthermore, 2 people use their money on lesiure , food and transport at 8000, 7000 and 6000. People who are living alone spend their less money on leisure things, food and transport at 5000, 4000 and 3000 as compare to three different sizes of familes.
Analysis of the chart reflects that clothing is not highly recommened by the three categories people it is least use by the person who is living alone at 2000 whereas, 2 person spend 3000 , while 4 people give money 4000 respectively.
AI examiner evaluation
| Criterion | Band |
|---|---|
| Task Achievement / Task Response | 6.0 |
| Coherence and Cohesion | 6.0 |
| Lexical Resource | 5.0 |
| Grammatical Range and Accuracy | 5.0 |
| Overall | 5.5 |
Task Achievement / Task Response: Band 6.0
You identify the main pattern that housing is the largest expense and clothing the smallest across all household sizes, and you include relevant comparisons for each category. Most figures are close to the chart, including housing at about $22,000 for four people and the lower spending by one-person households. However, the overview is awkwardly expressed, and some details are unclear or incomplete: for example, you call food the “second priority” without making clear that it is second only for four-person households, while leisure spending is actually higher than food for one- and two-person households. A clearer overview of the differing category patterns, followed by precise comparisons, would make the key features more fully developed.
Coherence and Cohesion: Band 6.0
The response has a recognisable structure: an introduction, an overview, and paragraphs describing the figures. It also groups information by household size and category, which helps the reader follow the comparisons. However, progression is sometimes mechanical, with repeated transitions such as “Moreover,” “Furthermore,” and “Analysis of the chart reflects.” Some links between ideas are unclear, particularly the shift from the four-person household’s food and transport spending to the two-person figures. Punctuation also interrupts flow in places, as in “A glance at the chart reveals that, housing is in the top.” Organise the body more consistently—for example, compare all household sizes within each category—and use fewer, more precise linking phrases.
Lexical Resource: Band 5.0
You use relevant task vocabulary, including “annual spending,” “categories,” “housing,” and “transport,” so the topic is generally clear. However, the range and control of vocabulary are limited, and several word choices or collocations sound unnatural: “housing is in the highest peak,” “clothing is the least use,” and “clothing is not highly recommended” do not accurately describe spending. There are also noticeable spelling errors, including “lesiure,” “fppd,” “differet,” and “familes.” Choose straightforward, accurate expressions such as “spent the most on housing” and “clothing accounted for the lowest expenditure.” Proofreading category names and using standard spending vocabulary would improve clarity.
Grammatical Range and Accuracy: Band 5.0
You attempt both simple and more complex sentences, and the reader can usually understand the comparisons. However, grammatical control is uneven, especially in sentence construction, articles, and agreement. For example, “it is clearly noticeable by the by the chart” is malformed and repetitive, while “housing is in the top” lacks a clear grammatical completion. In “People who are living alone spend their less money,” the comparative structure is incorrect; write “spend less money.” Commas are also misplaced, as in “A glance at the chart reveals that, housing…” Aim for complete, direct sentences and check articles, comparative forms, and punctuation. These revisions would make your meaning more consistently clear.
See this exact question answered at other band scores. The same prompt compared across bands.
Browse more IELTS Writing model answers or get your own writing scored by the same AI examiner.