Band 5.5 IELTS Writing Task 1 Model Answer
Overall Band Score: 5.5 · IELTS Predictions Nov 2026 · 2026-11-19
IELTS Writing Task 1 question
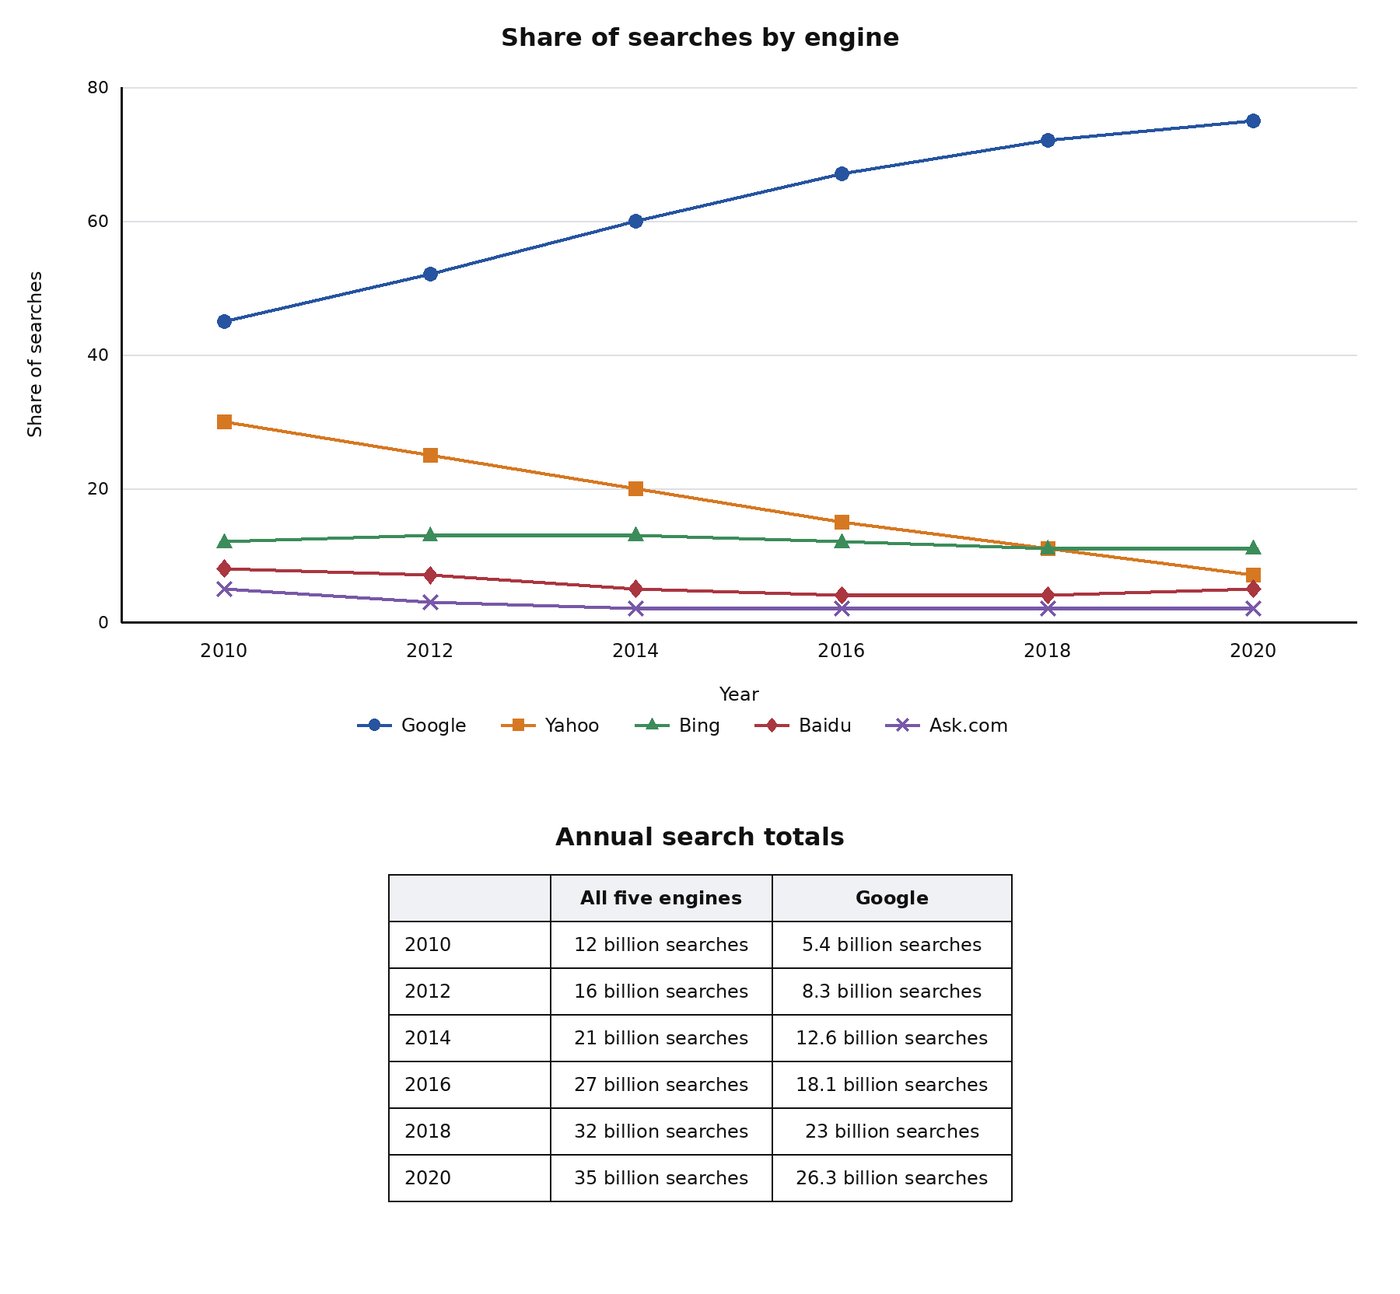
The line graph and table below show the percentage shares of five search engines and annual search totals in one country between 2010 and 2020.
Summarise the information by selecting and reporting the main features, and make comparisons where relevant.
Student answer (Band 5.5)
The line diagram illustrates, proportion of the share of five searches by engine and table below illustrates the annual search in all five engines between 2010 and 2020.
Overall, It can be seen that people tend to search through google remained its highest in percentage as compared to all other websites.Other all platforms decreased sharply till 2020.
According to table of research engine it can be seen that all five engines show greater amount of reasearch in 2020, including yahoo, bring ,baidu as well as ask.com.Apart from that google also show great search intrest in 2020 as comapred to all other five years .
By seeing line graph , share if searches through google remained at its peak that is around 43% in 2010 and increased gradually till 2020.On the otherhand Yahoo was at the second highest number in 2012 that is 25% .but after that , its percentage decreased sharply till 2020 reaching closing at 10% . Furthermore, bing website showed stable in its number that is amost 15% that percentage remained almost same in all years.Lastly the baidu and ask.com show similar trends in all year that percentage decrease slightly in 2016 but goes up little bit again in 2020 .
According to annual search total 2010 showed lowest searches in all modules including all five search engine as well as google that are 12 billion and 5.4 billion respectively.Whereas,2020 showed 35 billion search in all five engines that are highest in number but google search showed 26.3 billion in 2020.Overall, it can be sseen that the number of search increase steadily thoughout all year till 2020 in all engines.
AI examiner evaluation
| Criterion | Band |
|---|---|
| Task Achievement / Task Response | 6.0 |
| Coherence and Cohesion | 6.0 |
| Lexical Resource | 5.0 |
| Grammatical Range and Accuracy | 5.0 |
| Overall | 5.5 |
Task Achievement / Task Response: Band 6.0
You cover both the line graph and the table, and your overview identifies Google as the leading engine and notes the overall rise in search totals. Several key comparisons are also included, such as Google’s increase and Yahoo’s decline. However, some details are inaccurate or unclear: Google began at about 45%, rather than 43%, and Bing stayed around 11–13%, not almost 15%. The statement that all other platforms “decreased sharply” is too broad, since Bing was broadly stable and Baidu changed only slightly. Your table discussion reports the endpoints but could better compare the steady growth in Google searches with the growth in the total across all engines. More precise selection and reporting of these trends would make the account more complete.
Coherence and Cohesion: Band 6.0
The response has a recognisable structure: an introduction, an overview, discussion of the line graph, and a final paragraph on annual totals. This gives the reader a generally coherent route through both visuals. However, the overview is followed by a table paragraph and then a return to the graph, so the organisation could be more systematic—for example, group the line-chart trends together before discussing the table. Some linking phrases, including “According to” and “Apart from that,” are repeated or do not clearly show the relationship between ideas. The final paragraph also repeats the point that totals rose throughout the period. Clearer grouping and more precise referencing would strengthen the progression.
Lexical Resource: Band 5.0
You use relevant task vocabulary such as “percentage,” “decreased,” “stable,” and “annual search total,” so the main subject is usually understandable. However, the range is limited and several word choices or collocations are inaccurate, including “share if searches,” “search intrest,” and “showed stable in its number.” Spelling errors such as “reasearch,” “comapred,” and “sseen” also reduce clarity and polish. Repeated use of “search,” “show,” and “number” makes the description less precise. Aim to use standard chart language consistently, such as “accounted for,” “remained stable,” and “rose steadily,” and check spelling and word forms before submitting.
Grammatical Range and Accuracy: Band 5.0
You attempt both simple and more extended sentences, including comparisons introduced by “Whereas” and clauses describing changes over time. The overall meaning is generally recoverable, but errors in sentence construction and punctuation occur in several places. For example, “people tend to search through google remained its highest” combines incompatible structures, while “Bing website showed stable” lacks a suitable verb pattern. There are also issues with articles, agreement, and sentence boundaries, as in “the number of search increase steadily” and the run-on transitions around “2010 showed lowest searches.” Use a consistent past-tense reporting style, check subject–verb agreement, and separate complete sentences with appropriate punctuation.
See this exact question answered at other band scores. The same prompt compared across bands.
Browse more IELTS Writing model answers or get your own writing scored by the same AI examiner.