Band 5.0 IELTS Writing Task 1 Model Answer
Overall Band Score: 5.0 · IELTS Predictions Nov 2026 · 2026-11-19
IELTS Writing Task 1 question
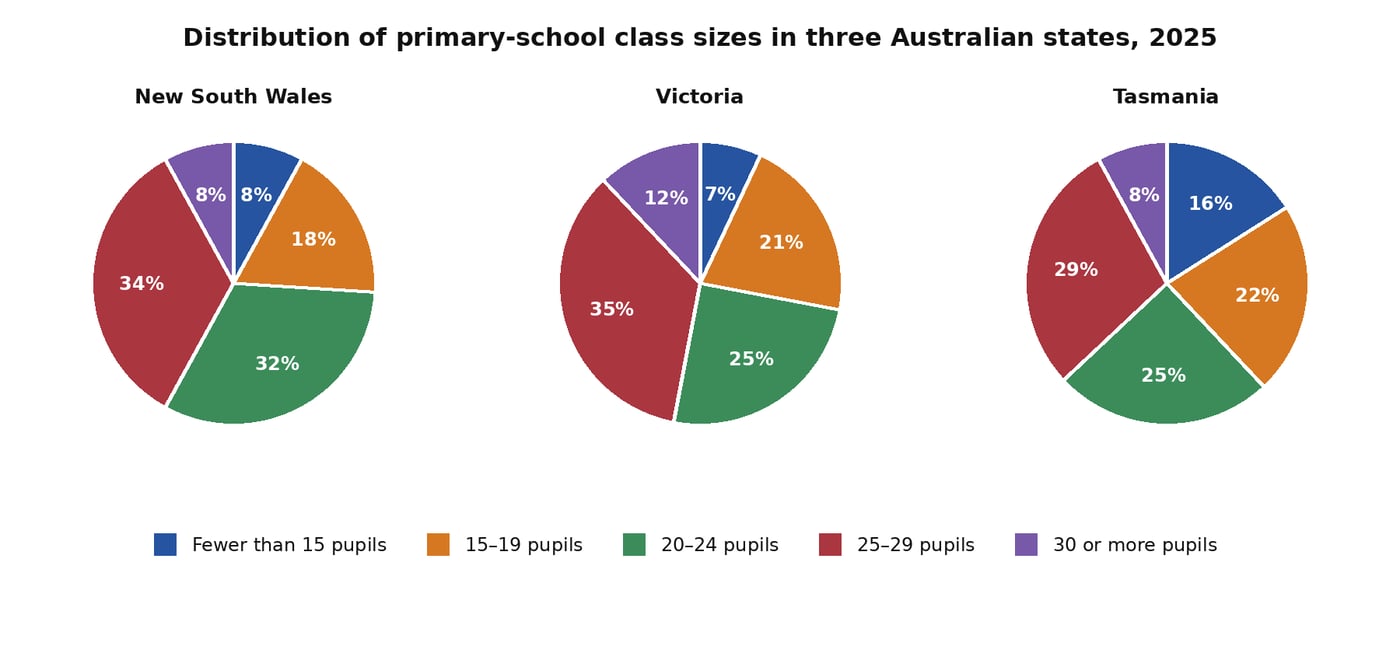
The charts below give information about the distribution of primary-school classes by size in New South Wales, Victoria and Tasmania in 2025.
Summarise the information by selecting and reporting the main features, and make comparisons where relevant.
Student answer (Band 5.0)
The chart below illustrates primary-school classes by size in three states, in the year 2025. There are five school sizes in each Australian state which summarise the number of pupils who attend primary school. We can see an insignificant number of kids with blue colour in New South Wales and Victoria, but in Tasmania the number of kids rises to 16% at the same school. It is almost the same number of kids in New South Wales and Tasmania and on the other hand in Victoria state the number of children grows to 12%. The yellow colour provides similar number of children but with a higher percentage for all three Australian states. The second school after this is shown in green which is higher and above 30% in New South Wales and 25% for the other states. The red colour shows us an impressive number of pupils showing us a huge size for that school in every state from this picture.
AI examiner evaluation
| Criterion | Band |
|---|---|
| Task Achievement / Task Response | 4.5 |
| Coherence and Cohesion | 4.5 |
| Lexical Resource | 5.0 |
| Grammatical Range and Accuracy | 5.5 |
| Overall | 5.0 |
Task Achievement / Task Response: Band 4.5
You identify the chart’s subject and refer to several categories, including the high share of 25–29-pupil classes and Tasmania’s 16% share of classes with fewer than 15 pupils. However, the response does not give a clear overview of the main patterns, and several comparisons are vague or inaccurate. For example, saying the “yellow colour” has a similar number but a higher percentage does not specify which class-size category or state is being compared. The claim that the “red colour” represents a huge class size in every state is also unclear: the 30-or-more category is only 8% in New South Wales and Tasmania, compared with 12% in Victoria. Select the largest and smallest categories, report their figures accurately, and summarise the key differences.
Coherence and Cohesion: Band 4.5
The response follows the chart’s categories in a rough sequence and uses linking expressions such as “on the other hand” and “after this.” This gives the reader some sense of progression. However, the ideas are not organised into a clear overview followed by supporting comparisons, and the colour references make the sequence difficult to follow because the categories are not named. Phrases such as “the second school after this” and “the red colour shows us” do not clearly connect the data to the point being made. Use a short overview, then group comparisons by class size or state, with explicit references such as “the 25–29-pupil category” and “in contrast.”
Lexical Resource: Band 5.0
You use some relevant vocabulary, including “percentage,” “primary-school classes,” and “pupils,” and the meaning is generally recoverable. However, the range is limited and several choices are imprecise or informal for an academic chart summary. Repeated references to “kids,” “number of children,” and colours obscure the data rather than describing it directly. “School sizes” is also inaccurate for class-size categories, while “an impressive number” and “huge size” are subjective and do not convey a precise comparison. Use terms such as “proportion,” “share,” “class-size category,” and “accounted for,” and name the pupil ranges instead of relying on colours.
Grammatical Range and Accuracy: Band 5.5
You attempt a mixture of simple and longer sentences, and most of the intended meaning can be understood. Some sentence patterns are controlled, such as “There are five school sizes in each Australian state,” but the response relies heavily on loosely connected clauses. In “It is almost the same number of kids in New South Wales and Tasmania and on the other hand in Victoria state the number of children grows to 12%,” the structure is awkward and the comparison is difficult to parse. The opening “There are five school sizes” also uses an imprecise noun phrase for the categories. Build clearer sentences with a subject and verb for each comparison, and use punctuation to separate contrasting information.
See this exact question answered at other band scores. The same prompt compared across bands.
Browse more IELTS Writing model answers or get your own writing scored by the same AI examiner.