Band 5.5 IELTS Writing Task 1 Model Answer
Overall Band Score: 5.5 · IELTS Predictions Nov 2026 · 2026-11-22
IELTS Writing Task 1 question
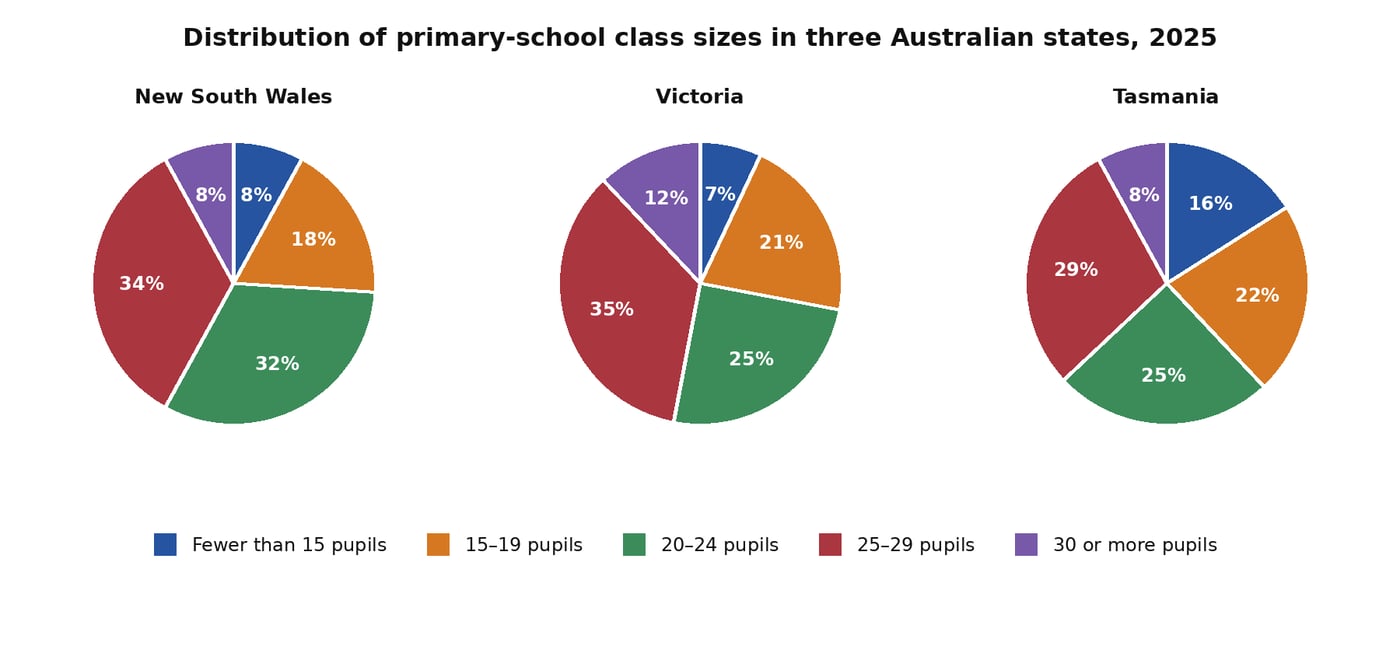
The charts below give information about the distribution of primary-school classes by size in New South Wales, Victoria and Tasmania in 2025.
Summarise the information by selecting and reporting the main features, and make comparisons where relevant.
Student answer (Band 5.5)
The pie chart illustrates the data of distribution of primary-school classes on the basis of their size in New South Walves, Victoria, and Tasmania in the year 2025. Overall, 25-29 pupils are highest in all states and size of fewe and more students are the lowest. other shows a peak and trough in thir sizes.
On the one hand, the distribution of 25-29 pupils are highest in all states. In Neu South Wales the percentage of 25-29 pupils is 34%. In Victoria it is 35% higher then New South Walves. In Tasmania it is 29% lower than others. 20-24 pupils distributed as the second highest in all states. 32% in New South Walves, 25% in Victoria, followed by Tasmania with distribution of 25%.
On the other hand, fewer than 15 pupils and 30 or more pupils are the lowest among full distribution. Both are 8% in New South Walves, 7% and 12% in Victoria, and 16% and 8% in Tasmania. 15-19 pupils distributed as the highest of fewer than 15 pupils and 30 or more pupils, with percentage of 18% in New South Walves, 21% in Victoria, and 22% in Tasmania.
AI examiner evaluation
| Criterion | Band |
|---|---|
| Task Achievement / Task Response | 6.0 |
| Coherence and Cohesion | 6.5 |
| Lexical Resource | 5.0 |
| Grammatical Range and Accuracy | 5.0 |
| Overall | 5.5 |
Task Achievement / Task Response: Band 6.0
You identify the main pattern that the 25–29-pupil category is largest in each state, and you report several relevant figures accurately, including 34% in New South Wales and 35% in Victoria. You also compare the 20–24 category and include the smaller class-size groups. However, the overview is unclear: “size of fewer and more students are the lowest” does not capture that the smallest shares vary by state, and the claim that 25–29 pupils are “35% higher” in Victoria is inaccurate—the figure is 35%, compared with 34% in New South Wales. Some comparisons are underdeveloped, particularly the contrast between states. State the key patterns precisely in the overview, then use accurate comparisons to support them.
Coherence and Cohesion: Band 6.5
The response has a recognisable structure: an introduction and overview are followed by two paragraphs grouping the larger and smaller class categories. “On the one hand” and “On the other hand” help signal this division, and the figures generally appear in a sensible order. However, progression is not always smooth, and some links are mechanical or unclear. For example, “other shows a peak and trough in thir sizes” does not clearly connect to the overview, while “15–19 pupils distributed as the highest of fewer than 15 pupils and 30 or more pupils” makes the comparison difficult to follow. Use clearer topic sentences and connect each comparison explicitly to the relevant state or category. This would build on the coherent overall arrangement and make the relationships easier to understand.
Lexical Resource: Band 5.0
You use relevant task vocabulary such as “distribution,” “percentage,” “pupils,” and “highest,” so the reader can identify the subject and most comparisons. However, the range is limited and several word choices or collocations are inaccurate, sometimes making the meaning unclear. “25-29 pupils are highest” should refer to the proportion of classes, not the pupils themselves; “distributed as the second highest” is also unnatural. Spelling errors such as “New South Walves,” “Neu,” and “fewe” are noticeable, and “thir sizes” is unclear. Aim for precise phrases such as “the largest share of classes” and “accounted for,” and proofread state names and category labels carefully.
Grammatical Range and Accuracy: Band 5.0
You attempt both simple statements and longer comparisons, and the reader can understand many of the figures. However, grammatical control is inconsistent, especially with subject–verb agreement, sentence construction, and articles. For example, “25-29 pupils are highest” needs a grammatical subject such as “The 25–29 category has the highest proportion,” while “20-24 pupils distributed as the second highest” is missing a verb. The phrase “In Victoria it is 35% higher then New South Walves” also has an unclear comparison structure. Some sentences are fragments or awkwardly joined, including “other shows a peak and trough in thir sizes.” Practise complete, direct comparison sentences and check that each clause has a clear subject and verb.
See this exact question answered at other band scores. The same prompt compared across bands.
Browse more IELTS Writing model answers or get your own writing scored by the same AI examiner.