Band 5.5 IELTS Writing Task 1 Model Answer
Overall Band Score: 5.5 · IELTS Last Minute Nov 2026 · 2026-11-20
IELTS Writing Task 1 question
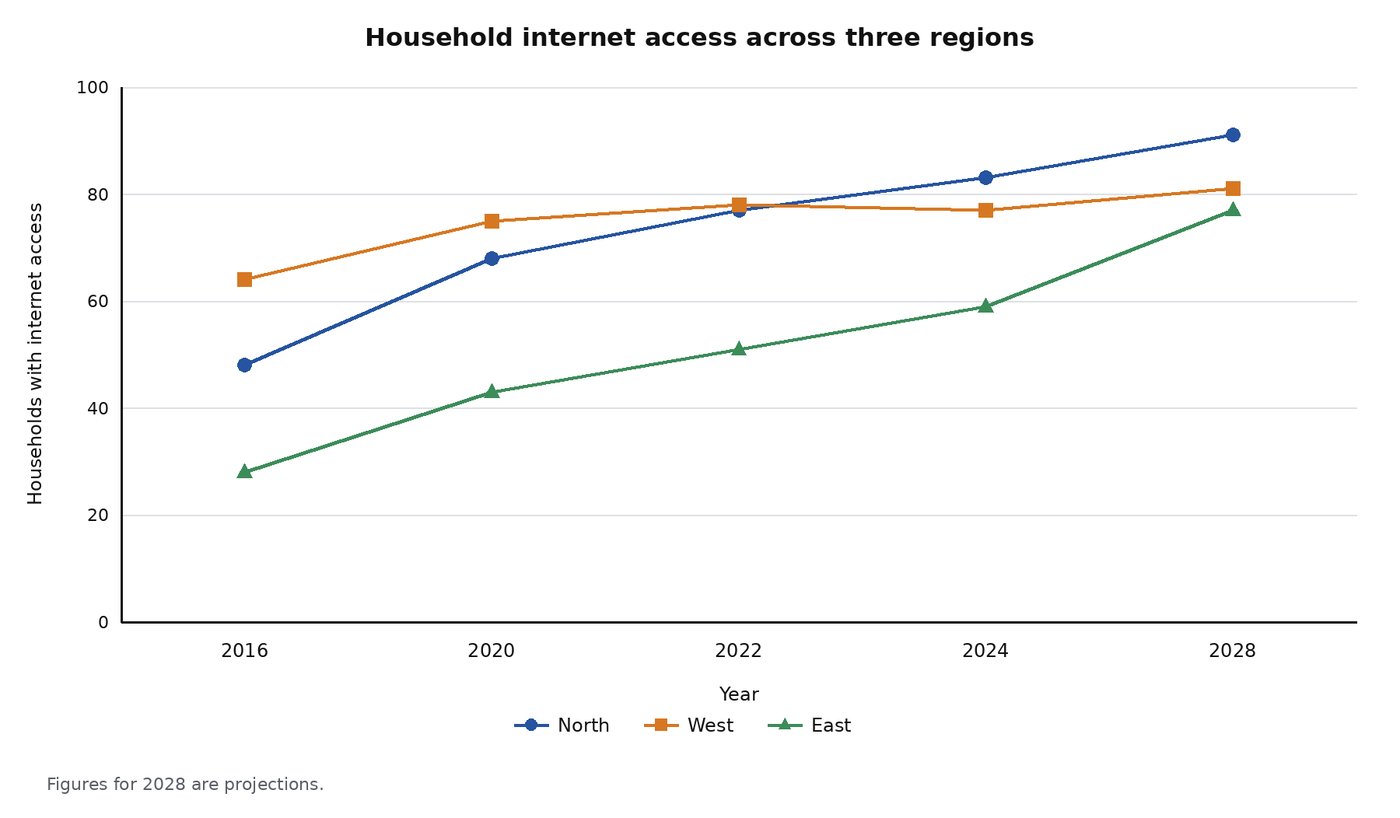
The graph below shows the share of households with internet access in three regions from 2016 to 2028; the figures for 2028 are forecasts.
Summarise the information by selecting and reporting the main features, and make comparisons where relevant.
Student answer (Band 5.5)
The line graph illustrates the internet accessibility in houses of three regions namely North, the west and the east over the period 2016 to 2028 which are forecasted. The data id quantified in numbers.
Overall, it is evident that the east region has rose dramatically. The west had tiny increase in the internet access and the north region showed a significant increase in the accessbility.
Firtsly, in 2016, the east region had roughly around 25 house ith internet, it showed a constant growth reaching just under 60, in 2024 and estimated to reach approximately 79 by 2028.Furthermore, the north area it had approximately half of houshold with internet acess, in 2026, it surged to cross the 80 marks and in 2024, the north sector has 85 houshold with internet. It is therefore predicted to reach 90 by 2028.
Lastly, the west region, in 2016, it had roughly 65 homes with internet connectivity and uplifited the graph to make it to 78, in 2022. It got stabled and then dropped to 75, in 2024, but it is expected to cross and reach 82 by 2028.
AI examiner evaluation
| Criterion | Band |
|---|---|
| Task Achievement / Task Response | 5.5 |
| Coherence and Cohesion | 6.0 |
| Lexical Resource | 5.5 |
| Grammatical Range and Accuracy | 5.0 |
| Overall | 5.5 |
Task Achievement / Task Response: Band 5.5
You identify the broad pattern that access rises in the North and East, while the West changes less, and you include figures for all three regions. However, some key details are inaccurate or unclear: the North reaches about 83% in 2024, not 85%, and the reference to 2026 is inconsistent with the chart, which shows 2022. The West rises to about 78% in 2022, dips slightly to 77% in 2024, then is projected at 81%; your account of a drop to 75% and a rise to 82% misstates these values. The overview also misses the important comparison that the West starts highest, while the North is projected to finish highest. Select and report the main comparisons more precisely, and distinguish actual data from the 2028 forecast.
Coherence and Cohesion: Band 6.0
The response has a recognisable structure: an introduction, an overview, and paragraphs describing the regions. Sequencing expressions such as “Overall,” “Firstly,” and “Lastly” help the reader follow the account, and the regional grouping is generally understandable. However, the progression is sometimes weakened by unclear references and awkward links, for example, “in 2026” appears without explanation, and “It got stabled and then dropped” does not clearly identify the West as its subject. The overview and detail paragraphs also repeat general statements about increases without consistently organising the comparisons around the main trends. Use clearer topic sentences and refer to each region explicitly when moving between figures; connect the data points to show how the regions compare.
Lexical Resource: Band 5.5
You use a reasonable range of task-related vocabulary, including “surged,” “estimated,” “predicted,” and “internet connectivity,” and the meaning is usually recoverable. However, several word choices and collocations are inaccurate or unnatural, such as “internet accessibility in houses,” “tiny increase,” “uplifited the graph,” and “got stabled.” Spelling errors, including “Firtsly,” “accessbility,” “houshold,” and “acess,” are also noticeable and reduce precision. Some phrases are unnecessarily wordy, such as “roughly around 25.” Aim for standard chart language and accurate forms: describe percentages of households with access, say that a figure “rose” or “remained stable,” and use “approximately” only once when giving an estimate.
Grammatical Range and Accuracy: Band 5.0
You attempt both simple and more extended sentences, including clauses with “while” and “which,” but control is inconsistent. Errors in verb forms and sentence construction occur in examples such as “the east region has rose,” “the north area it had,” and “It got stabled.” There are also problems with articles, plurals, and prepositions in phrases such as “half of houshold” and “reach 90 by 2028,” where the unit should be made clear. Punctuation and spacing are uneven, particularly in “2028.Furthermore,” and several sentences join multiple data points without clear grammatical links. Practise accurate past-tense descriptions for historical figures and use “is projected to” for forecasts; then check each sentence for a clear subject and verb.
See this exact question answered at other band scores. The same prompt compared across bands.
Browse more IELTS Writing model answers or get your own writing scored by the same AI examiner.