Band 6.0 IELTS Writing Task 1 Model Answer
Overall Band Score: 6.0 · IELTS Predictions Nov 2026 · 2026-11-22
IELTS Writing Task 1 question
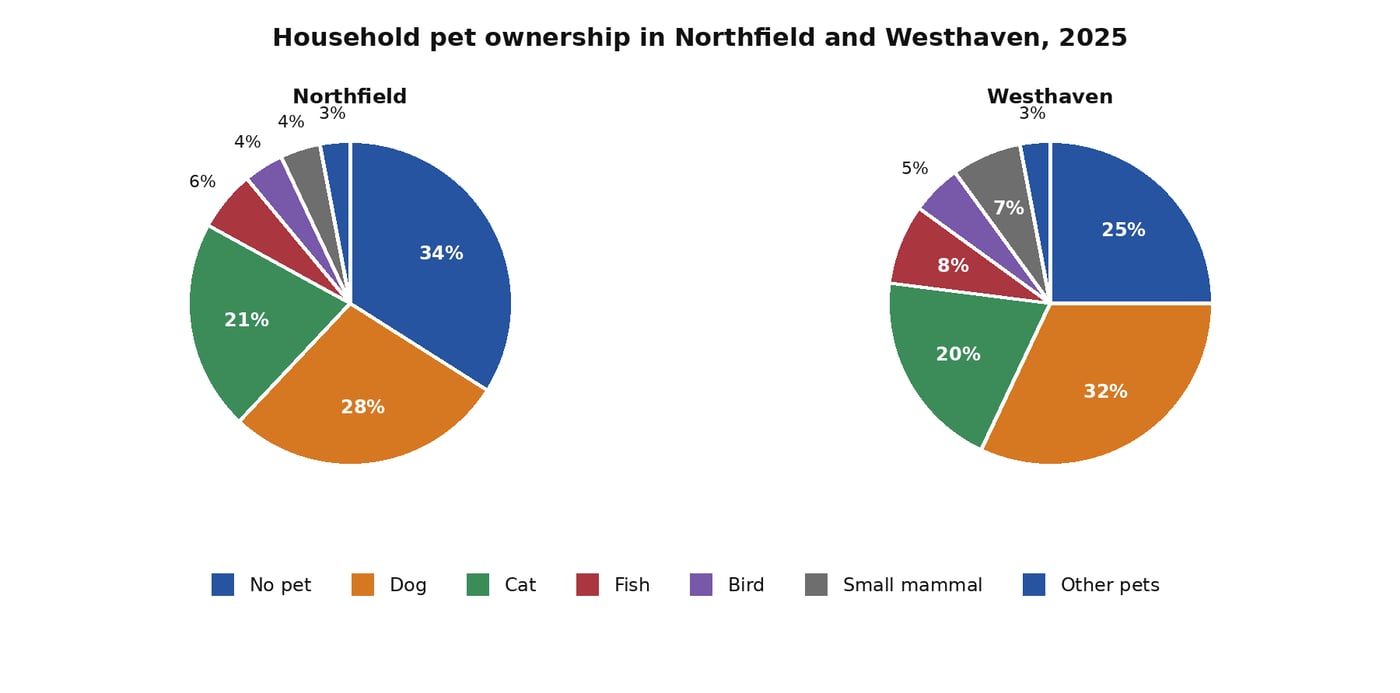
The charts below show the percentage of households in Northfield and Westhaven by the main type of pet they keep in 2025.
Summarise the information by selecting and reporting the main features, and make comparisons where relevant.
Student answer (Band 6.0)
The given pie chart depicts the information ratio of northfield and westhaven households by main kind of pet kept in 2025.
By overall analyses, it clearly seen that in westhaven houses the percentage of dog,small mammal and fish were approximately higher while in noerthfield household dog,fish and other mammles were lessen in ratio ,however, no pet had enormously highest.
In 2025 Northfield houses , the percentage of no pet was 34% which was highest where as dog were only 28% . The ratio of fish, bird, small mammal and other pets had compartively similar which was 6%, 4%,4%,3% respectively . Lastly, cat had shared only 21% .
On the other hand , In Westhaven household dog had 32% double in ratio as compare to cat which was solely 20% while 25% household had no pet. Moreover, percentage of other pets, bird, small mammal and fish had minor difference which was 3%,5%,7%,8% respectively.
AI examiner evaluation
| Criterion | Band |
|---|---|
| Task Achievement / Task Response | 6.0 |
| Coherence and Cohesion | 6.5 |
| Lexical Resource | 5.5 |
| Grammatical Range and Accuracy | 5.0 |
| Overall | 6.0 |
Task Achievement / Task Response: Band 6.0
You cover both locations and report the main categories with mostly accurate figures, including Northfield’s highest share for households with no pet (34%) and Westhaven’s highest share for dogs (32%). You also include useful comparisons, such as the similar cat figures (21% and 20%). However, the overview is unclear and contains a factual contradiction: it says dogs were higher in Westhaven, then says Northfield’s dog share was lower, although the latter comparison is true only relative to Westhaven. It also incorrectly suggests that Northfield’s fish share was lower; it was 6%, compared with 8% in Westhaven. The overview should clearly identify the main contrast—more pet-free households in Northfield, but more dog-owning households in Westhaven—and distinguish these from the smaller categories.
Coherence and Cohesion: Band 6.5
The response has a recognisable structure: an introduction, an overview, and separate paragraphs for Northfield and Westhaven. This makes the information easy to locate, and phrases such as “On the other hand” signal a comparison between the two places. The progression is generally logical, but the overview’s comparisons are difficult to follow, particularly the sentence beginning “in westhaven houses” and continuing with “while in noerthfield household.” Some linking phrases are also used mechanically, and the final paragraph lists several minor categories without connecting them to the main comparison. To strengthen progression, organise the overview around the two leading contrasts, then group the smaller pet categories and compare their figures directly.
Lexical Resource: Band 5.5
You use relevant vocabulary for describing charts, including “percentage,” “ratio,” “highest,” and “minor difference,” and the reader can generally identify the categories being discussed. However, several word choices and collocations are inaccurate or unnatural, such as “information ratio,” “by overall analyses,” “had shared only,” and “double in ratio as compare to.” Spelling errors, including “noerthfield” and “mammles,” also reduce precision. Some repetition of “percentage” and “ratio” makes the description less flexible. Aim for standard chart language such as “proportion of households,” “accounted for,” and “compared with,” and check spelling and word forms carefully so that your comparisons sound clear and natural.
Grammatical Range and Accuracy: Band 5.0
You attempt both simple statements and longer sentences with contrast, for example, “On the other hand, In Westhaven household dog had 32% … while 25% household had no pet.” This shows some range, but control is inconsistent, and several sentence patterns contain errors that make the relationships harder to understand. Examples include “it clearly seen,” which needs a verb such as “it is clear,” and “the percentage … were,” where the singular subject requires “was.” Articles and plurals are also often missing or mismatched, as in “Westhaven household” and “dog were.” Improve accuracy by checking subject–verb agreement, articles, and plural forms, and by breaking the overview’s long, unclear sentence into shorter comparisons.
See this exact question answered at other band scores. The same prompt compared across bands.
Browse more IELTS Writing model answers or get your own writing scored by the same AI examiner.