Band 5.0 IELTS Writing Task 1 Model Answer
Overall Band Score: 5.0 · Cambridge IELTS 19 · 2026-11-07
IELTS Writing Task 1 question
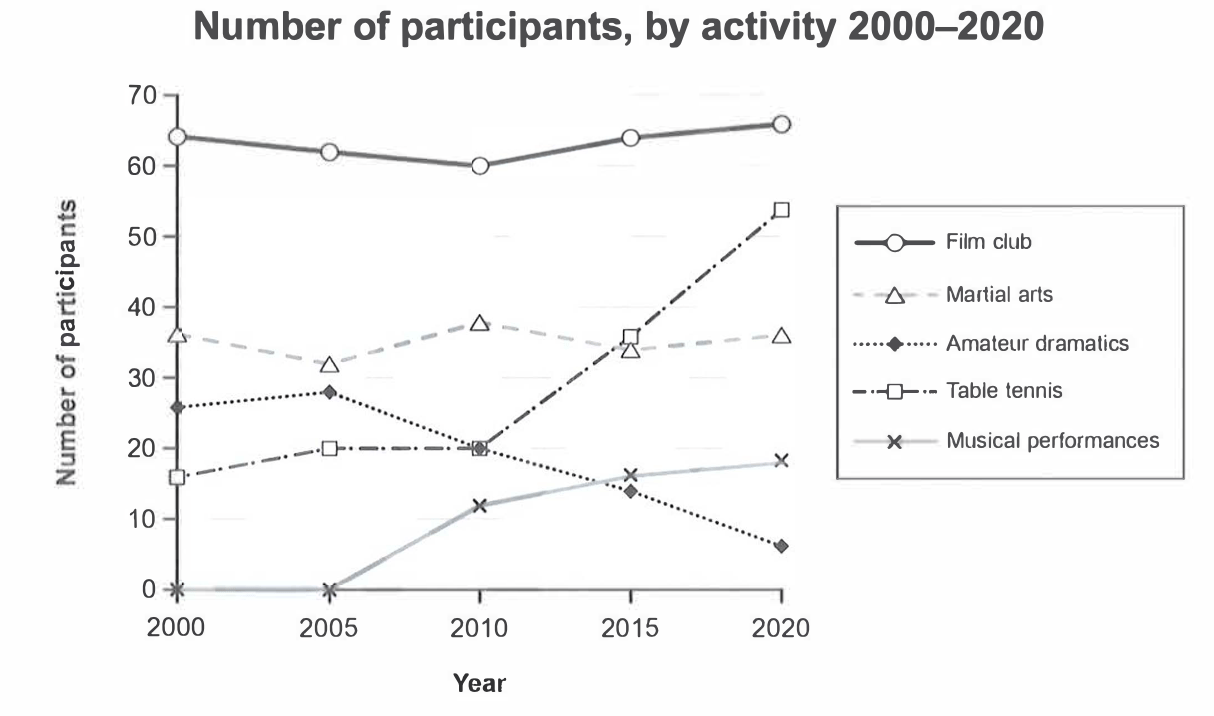
The graph below gives information on the numbers of participants for different activities at one social centre in Melbourne, Australia for the period 2000 to 2020.
Summarise the information by selecting and reporting the main features, and make comparisons where relevant.
Student answer (Band 5.0)
The line graph illustrate the number of participants,who did different activities in social centre in Melbourne,Australia for 2000 to 2020.
Overall,its clear that the highest figure was table tanis,while the lowest figure was Amateur dramatics.
First of all, Film club property was 65% in 2000,which remained stable till 2020,which had a major change. In 2020, the property was 67%.Second highest figure was table tanis.We can see a noticeable change in 2000 t0 2020.Table tanis had 15% in 2000 which increase to 55%.
Furthermore,the lowest figure was musical performance ,which upward in 2010.Moreover,the figure was 15%
In conclusion, the highest property was film club,which was 65% wheras the lowest percentage was musical performances,which was 15%.
AI examiner evaluation
| Criterion | Band |
|---|---|
| Task Achievement / Task Response | 4.0 |
| Coherence and Cohesion | 5.5 |
| Lexical Resource | 5.0 |
| Grammatical Range and Accuracy | 5.0 |
| Overall | 5.0 |
Task Achievement / Task Response: Band 4.0
You identify several relevant activities and attempt an overview, but the main features are not reported accurately or consistently. The opening overview says table tennis was highest and amateur dramatics lowest, whereas film club was highest throughout and musical performances began at zero. Later, you call film club the highest, so the overview contradicts itself. The claim that film club remained stable is broadly reasonable, but the figures are given as percentages rather than participant numbers. Table tennis’s rise and amateur dramatics’ decline are important trends, yet the latter is barely described. Musical performances are also misidentified as the lowest overall. The response is 114 words, below the required 150, leaving key comparisons underdeveloped. Include a clear, accurate overview and report the main changes across all series.
Coherence and Cohesion: Band 5.5
There is some organisation: an introduction is followed by an overview, details introduced with “First of all” and “Furthermore,” and a concluding sentence. This gives the response a recognisable structure. However, progression is limited because the details do not consistently build on the overview, and the conclusion repeats a claim that conflicts with it. For example, table tennis is first described as the highest, but the conclusion names film club as highest. Linking phrases such as “Moreover” and “In conclusion” are present, though they do not always clarify how the information relates. Group the activities by their trends, and use references and transitions to make comparisons clear rather than repeating rankings.
Lexical Resource: Band 5.0
Your vocabulary is sufficient to identify the chart’s activities and describe basic movement, with phrases such as “noticeable change” and “remained stable.” However, the range is limited and several word choices or forms make the report less precise. “Property” is repeatedly used where “figure” or “number of participants” is intended, and “percentage” is inaccurate because the graph reports participant counts. “Table tanis” is misspelled, while “musical performance” does not match the chart’s label, “musical performances.” Some phrasing, including “which upward in 2010,” is difficult to interpret. Use accurate chart vocabulary consistently and check spelling and collocations; this will make the comparisons easier to understand.
Grammatical Range and Accuracy: Band 5.0
You use mostly simple sentence patterns and make some attempts to connect clauses with “which” and “while.” However, errors occur frequently in sentence construction, agreement, articles, and punctuation. The opening, “The line graph illustrate,” has a subject–verb agreement error, and “who did different activities” is an awkward relative clause for describing participants. Missing spaces after commas and full stops, as in “participants,who” and “67%.Second,” also affect readability. Several clauses are incomplete or poorly formed, particularly “which upward in 2010,” while repeated “which” clauses make relationships unclear. Practise accurate simple sentences first, then add controlled comparisons using forms such as “rose from … to …” and “while … declined.”
See this exact question answered at other band scores. The same prompt compared across bands.
Browse more IELTS Writing model answers or get your own writing scored by the same AI examiner.