Band 5.0 IELTS Writing Task 1 Model Answer
Overall Band Score: 5.0 · Cambridge IELTS 19 · 2026-11-12
IELTS Writing Task 1 question
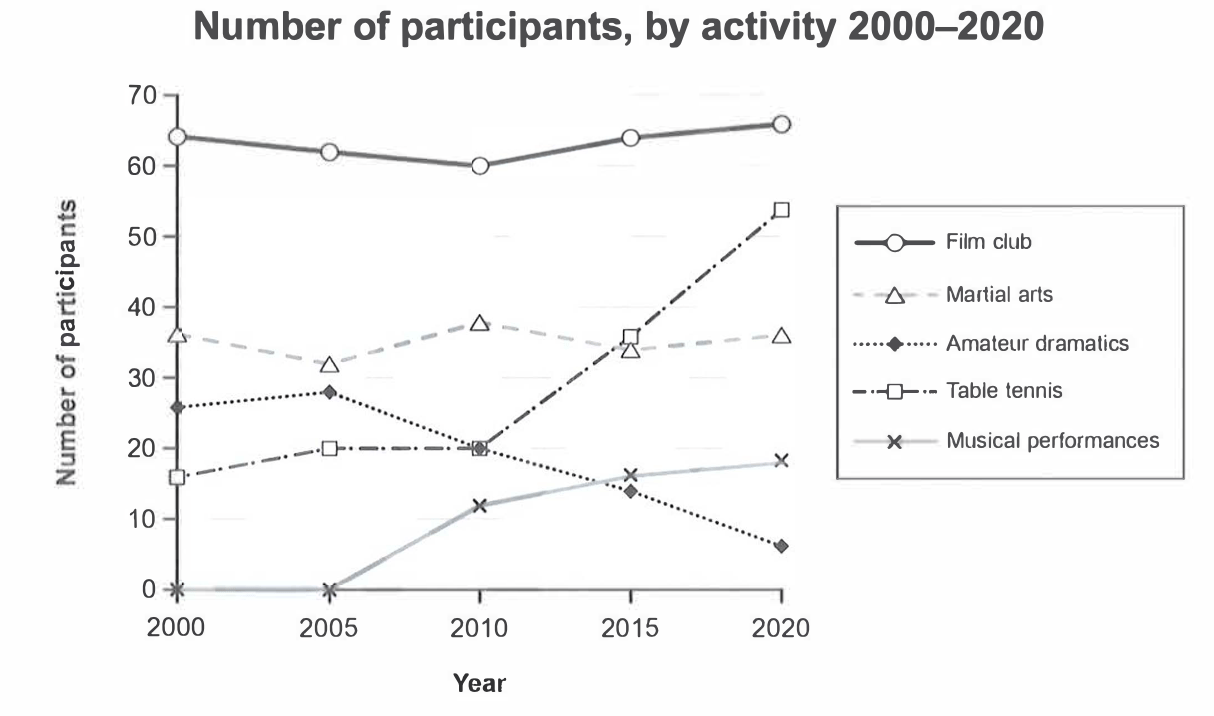
The graph below gives information on the numbers of participants for different activities at one social centre in Melbourne, Australia for the period 2000 to 2020.
Summarise the information by selecting and reporting the main features, and make comparisons where relevant.
Student answer (Band 5.0)
The graph shows the number of participants for different activities at one social centre in Melbourne, Australia for the period 2000 to 2020.
The grapha has two planes vertical and horizontal, also called x and y axis.The x axis shows the years from 2000 to 2020 and the y axis shows the percentage of people participating in the activities.
People took part most in film club because new genertion people wants to become more popular,the film club is represented by circle and its ratio is 65 percent.
Then comes the Table tennis in early 2000s people did not show much interest in it but in later people started taking part in it and in 2020 its ratio is more then 50 percent,it is represented by Square shape.
On 3rd place people take interest in martial arts, it is represented by triangle shape its ration is almost 37 percent.
Then on 4th place Amateur dramatics come in ealy 2000s people started taking part in it but later its average drops and in 2020 its average was almost 2 percent,it is represented by diamond shape.
In last place musical performances comes it is represented by x symbol and early
2000s people dont take interest in it but later people stares taking part in it an it become some popular, in 2020 its averge was 18 percent.
AI examiner evaluation
| Criterion | Band |
|---|---|
| Task Achievement / Task Response | 4.5 |
| Coherence and Cohesion | 5.0 |
| Lexical Resource | 5.0 |
| Grammatical Range and Accuracy | 5.0 |
| Overall | 5.0 |
Task Achievement / Task Response: Band 4.5
You identify all five activities and give some relevant comparisons, including film club as the leading activity, table tennis rising to above 50 participants, and amateur dramatics declining. However, the account is only partially accurate and lacks a clear overview of the main trends. The graph reports numbers of participants, not percentages, so descriptions such as “65 percent” and “18 percent” misrepresent the units. The claim that amateur dramatics fell to “almost 2 percent” is also inaccurate; it ends at about 6 participants. The explanation that film club is popular because younger people want to become popular is invented and unsupported by the graph. Focus on the key changes and report approximate participant numbers accurately.
Coherence and Cohesion: Band 5.0
The response has some organisation: it introduces the graph and then discusses activities in a roughly ranked sequence, using phrases such as “Then comes” and “In last place.” This gives the reader a basic route through the information. However, the progression is not consistently clear, and the repeated ranking format makes the report feel like a list rather than a comparison of trends over time. There is no distinct overview of the most important changes, and several sentences combine multiple points without clear links. Grouping the activities by trend—for example, stable or fluctuating figures, sharp growth, and decline—and using clear paragraphs would improve the overall progression. Use linking expressions selectively rather than repeating “Then” and “it is represented by”.
Lexical Resource: Band 5.0
You use enough basic vocabulary to identify the activities and describe simple changes, including “drops,” “taking part,” and “popular.” However, the range is limited and several choices are imprecise for describing a line graph. “Ratio” and “average” do not accurately describe the figures shown, while “percentage” confuses participant numbers with proportions. There are also noticeable spelling errors, such as “genertion,” “ealy,” “ration,” and “averge,” which reduce the clarity and polish of the report. The repeated phrases “people started taking part” and “people did not show much interest” also limit variety. Practise precise trend vocabulary and use “participants” or “the number” consistently when reporting the data.
Grammatical Range and Accuracy: Band 5.0
The response communicates its general meaning through mostly simple sentences, but grammatical control is inconsistent, and attempts to connect several ideas often produce errors. For example, “the x axis shows the years … and the y axis shows the percentage” is understandable, but the sentence needs more accurate punctuation and the correct data description. In “early 2000s people dont take interest in it but later people stares taking part,” the clauses lack clear punctuation and the verb forms and agreement are faulty. Other examples include “people wants” and “Amateur dramatics come.” Sentence structures are repetitive, with limited use of accurate complex forms. Build shorter, complete sentences first, checking subject–verb agreement, tense, articles, and punctuation before combining ideas.
See this exact question answered at other band scores. The same prompt compared across bands.
Browse more IELTS Writing model answers or get your own writing scored by the same AI examiner.