Band 5.0 IELTS Writing Task 1 Model Answer
Overall Band Score: 5.0 · Cambridge IELTS 19 · 2026-11-13
IELTS Writing Task 1 question
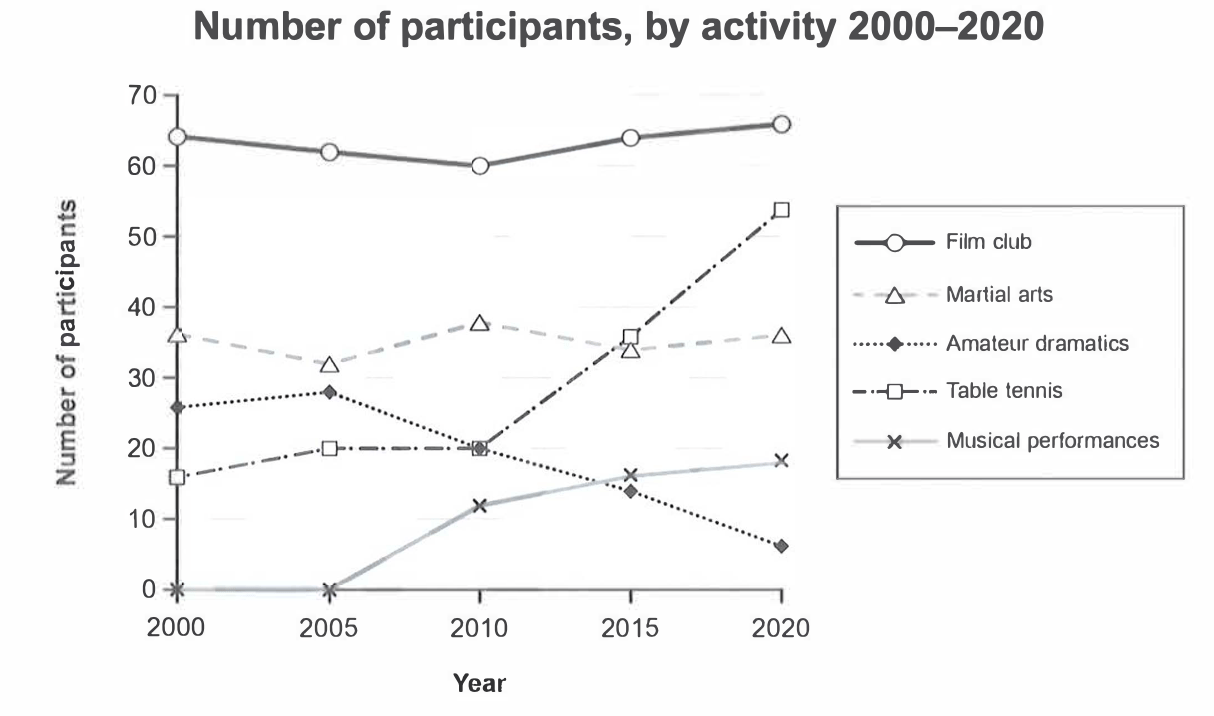
The graph below gives information on the numbers of participants for different activities at one social centre in Melbourne, Australia for the period 2000 to 2020.
Summarise the information by selecting and reporting the main features, and make comparisons where relevant.
Student answer (Band 5.0)
The graph below shows information on the numbers of participants for different activities at one social center in Australia for the period 2000 to 2020.
The participants are include in different activities like film club, marital arts, amateur dramatics, table tennis, musical performances.The ratio of participants is also given from year 2000 to 2020.
The ratio of film club participants is usually high from 2000 to 2020 overall, and the ratio is approximately 65%.The ratio of Martial arts participants is average between 2000 to 2020 and it is 35%.The ratio of Amateur dramatics participants was high in 2000 with ratio of 25% and in 2005 it went to 35% and in 2010 it comes to 20% and in 2015 it comes to 10% approximatelt and in 2020 the ratio went to 0%.The ratio of table tennis was low in 2000, 2005, 2010 with percentage of 15, 20, 20 respectively,and it went to high in 2015 and 2020 with ratio of 35 and 55 respectively.The ratio of musical performance was also low in 2000 and 2005 with percentage of 0%, and it went to 20% approximately in 2010, 2015, 2020.
AI examiner evaluation
| Criterion | Band |
|---|---|
| Task Achievement / Task Response | 5.0 |
| Coherence and Cohesion | 5.0 |
| Lexical Resource | 5.0 |
| Grammatical Range and Accuracy | 5.0 |
| Overall | 5.0 |
Task Achievement / Task Response: Band 5.0
You identify all five activities and make some relevant comparisons, including the film club’s consistently high participation and the sharp rise in table tennis. However, the response only partially reports the graph’s main features: it gives no clear overall summary of the contrasting trends, and several figures or descriptions are inaccurate. For example, amateur dramatics rises from 26 to 28 participants in 2005, not to 35, while musical performances reach about 12, 16 and 18 participants in 2010, 2015 and 2020, rather than approximately 20 throughout. The figures are numbers of participants, not percentages or ratios. Select the most important trends, report them accurately, and include a concise overview.
Coherence and Cohesion: Band 5.0
The response follows the graph’s categories and moves broadly from one activity to the next, so the reader can identify the subject of each statement. However, it is presented as one continuous block, with no distinct overview or clear paragraphing to guide the reader through the main trends and supporting details. Repeated openings such as “The ratio of…” make the progression mechanical, and the long sentence listing amateur dramatics figures is difficult to follow. Group the activities by trend—for example, consistently high or rising participation versus declining participation—and use a separate overview paragraph. Vary sentence openings and use clear links between comparisons so the information develops in a more logical sequence.
Lexical Resource: Band 5.0
You use enough basic vocabulary to name the activities and describe simple changes, including “went to high” and “went to low.” However, the range is limited and repetitive, particularly through repeated use of “ratio,” “high,” and “low.” These choices are also imprecise because the graph shows participant numbers, not percentages or ratios. Some word choices and forms are inaccurate, such as “marital arts” for “martial arts” and “approximatelt” for “approximately”; “musical performance” also does not consistently match the chart label. Use precise trend vocabulary such as “number,” “remained stable,” “declined,” and “rose sharply,” and check spelling and the exact activity names. This would make the descriptions clearer and more appropriate for an academic report.
Grammatical Range and Accuracy: Band 5.0
You communicate the general subject and attempt to describe changes across several years, but the sentence structures are mostly simple and repetitive, and frequent grammatical errors make parts of the report awkward. For example, “The participants are include in different activities” has an incorrect verb construction, while “The ratio of Amateur dramatics participants was high … and in 2005 it went to 35%” shifts awkwardly between past and present forms. Missing spaces after full stops and commas, as in “65%.The” and “respectively,and,” also affect readability. Practise accurate subject–verb patterns and past-tense descriptions, and combine related data using controlled clauses. For instance, a clear structure such as “Table tennis rose from 16 participants in 2000 to 54 in 2020” would improve both accuracy and variety.
See this exact question answered at other band scores. The same prompt compared across bands.
Browse more IELTS Writing model answers or get your own writing scored by the same AI examiner.