Band 5.5 IELTS Writing Task 1 Model Answer
Overall Band Score: 5.5 · Cambridge IELTS 19 · 2026-11-16
IELTS Writing Task 1 question
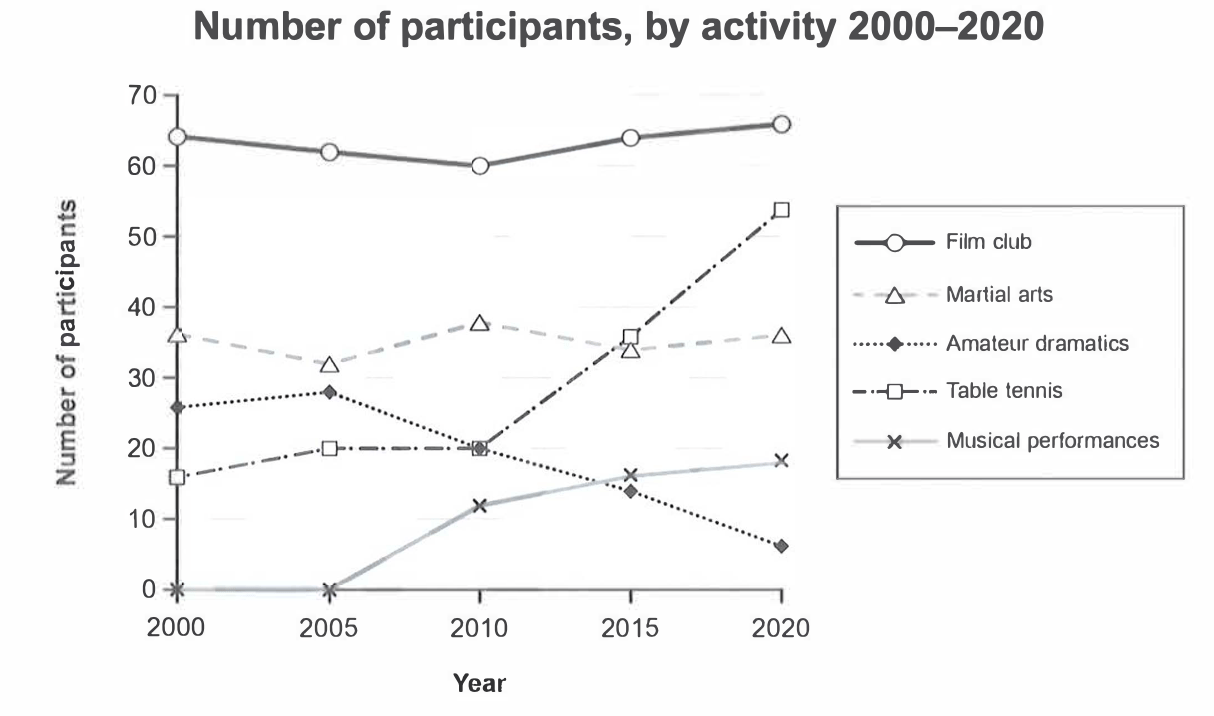
The graph below gives information on the numbers of participants for different activities at one social centre in Melbourne, Australia for the period 2000 to 2020.
Summarise the information by selecting and reporting the main features, and make comparisons where relevant.
Student answer (Band 5.5)
The graph demonstrates participants that took part at a social centre located in Melbourne, Australia between two decades, 2000 to 2020. There has been no data regarding participants that tookpart in musical performances from 2000 to 2005, however the number increased from10 participants in 2005 to 2010, with a steady increase in the years that followed. Table tennis saw a sharp rise in participants in 2010 where the participants increased drasticallyfrom around 20 to mid 50's in 2020. Amatuer dramatics has shown a steady trend involving 30 participants in the first five years, however the number of participants has seen a steady decline only leaving them at below 10 in 2020. Participants interested in martial arts have been steady with participants touching around 40 throughout these two decades, a slight change though, can be seen with numbers fluctuating betwene 30 to 40. Film club participants have the most numbers between 60 and 70 with the trend staying constant.
AI examiner evaluation
| Criterion | Band |
|---|---|
| Task Achievement / Task Response | 5.5 |
| Coherence and Cohesion | 5.5 |
| Lexical Resource | 5.5 |
| Grammatical Range and Accuracy | 5.5 |
| Overall | 5.5 |
Task Achievement / Task Response: Band 5.5
You identify several important patterns: film club remains the largest activity, table tennis rises markedly, and amateur dramatics declines to a very low level. However, some figures and time points are inaccurate. Musical performances begin at zero in 2000 and 2005, then rise to about 12 in 2010—not from 10 participants in 2005. Amateur dramatics starts at about 26, rather than 30, and falls steadily to around 6. The overview is also limited: it would be clearer to contrast the strong growth in table tennis with the decline in amateur dramatics, while noting that film club stays broadly stable at the top. More precise reporting and a fuller summary of the main trends would strengthen the response.
Coherence and Cohesion: Band 5.5
The response presents the activities in a generally understandable sequence, and linking expressions such as “however,” “where,” and “though” help connect details. Nevertheless, it is written as one long paragraph, so the overview and supporting comparisons are not clearly separated. The progression between activities can also feel list-like, and some links are awkward—for example, “Table tennis saw a sharp rise … where the participants increased” does not connect the ideas smoothly. Organise the response into a brief introduction, an overview of the main trends, and one or two paragraphs grouping the details. Use clearer transitions to show contrasts, such as the rise in table tennis compared with the fall in amateur dramatics.
Lexical Resource: Band 5.5
You use some relevant vocabulary for describing trends, including “sharp rise,” “steady increase,” “decline,” and “fluctuating.” However, several expressions are imprecise or repetitive: “participants that took part” and “participants interested in” repeat the same idea, while “has been steady with participants touching around 40” is not a natural way to describe the figures. There are also spelling errors, including “Amatuer” and “betwene,” and joined words such as “tookpart” and “drasticallyfrom” reduce accuracy. Choose concise chart language and check spelling and spacing. More precise verbs and phrases would help distinguish stable figures from rises and falls.
Grammatical Range and Accuracy: Band 5.5
You attempt a range of sentence forms, including clauses introduced by “however” and “where,” and the overall meaning is usually understandable. However, errors in sentence construction and punctuation sometimes make the relationships between ideas unclear. For example, “Table tennis saw a sharp rise … where the participants increased” uses an unsuitable clause structure, and “a slight change though, can be seen” has misplaced punctuation. Tense use is also inconsistent: the chart covers a completed period, but several descriptions use present perfect forms such as “has shown” and “has seen.” Use the past simple consistently for the historical data, and divide long sentences into clearer units with accurate clause links and punctuation.
See this exact question answered at other band scores. The same prompt compared across bands.
Browse more IELTS Writing model answers or get your own writing scored by the same AI examiner.