Band 5.5 IELTS Writing Task 1 Model Answer
Overall Band Score: 5.5 · Cambridge IELTS 19 · 2026-11-10
IELTS Writing Task 1 question
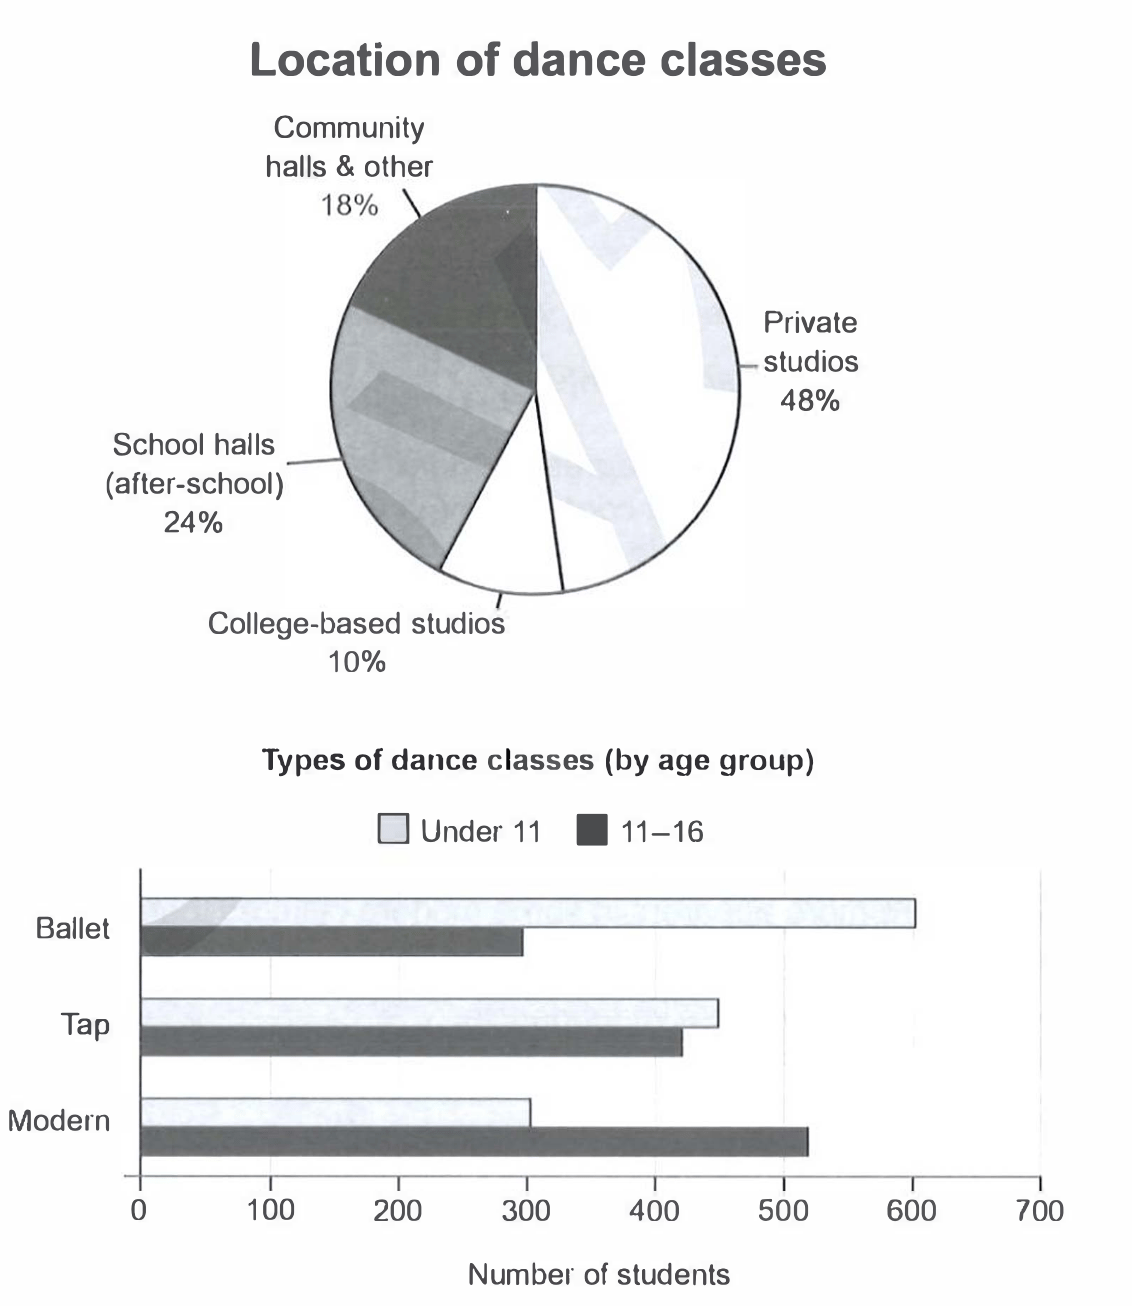
The charts below give information on the location and types of dance classes young people in a town in Australia are currently attending.
Summarise the information by selecting and reporting the main features, and make comparisons where relevant.
Student answer (Band 5.5)
The given pie, and bar graphs illustrates the detail of location and different kind of dance classes young people in a small city of Auatralia are presently attending.
Overall, these charts represents the information about dance classes and define area of dance accadimy with persentage and types of dance classes by age group.
The pie chart represent the dance class. The dance class are devided into 4 parts every part show different area of inside the dance class the max area in class private studios cover the area of 48% and school halls in 24% area community halls and other have 18% area cover and the college based studios cover minimum area only 10%.
The bar graph represent the types of dance classes and age groups with total number of students. The dance have 3 types ballet, tap, and modern dance in bullet 600 children have join under 11 and 300 are 11 to 16 ages. In tap the small difference in under all and upers under 11 have 450 and 11 to 16 have 420 students. The last is modern in modern under 11 children have only 300 and 11 to 16 have morethan 500.
AI examiner evaluation
| Criterion | Band |
|---|---|
| Task Achievement / Task Response | 5.5 |
| Coherence and Cohesion | 6.0 |
| Lexical Resource | 5.0 |
| Grammatical Range and Accuracy | 5.0 |
| Overall | 5.5 |
Task Achievement / Task Response: Band 5.5
You cover both charts and report the main location proportions accurately: private studios are largest at 48%, while college-based studios are smallest at 10%. You also identify the key age-group contrasts in the bar chart: ballet is more popular among under-11s, whereas modern attracts more 11–16-year-olds. However, some figures are imprecise or misreported: modern for the older group is about 520, not simply “more than 500,” and the tap figures are 450 and 420, so the difference is small but the older group is lower. The overview is vague and does not clearly summarise the main contrasts. State these overall patterns directly, then support them with accurate comparisons.
Coherence and Cohesion: Band 6.0
The response has a recognisable structure: an introduction, an overview, and separate paragraphs for the two charts. This makes the information broadly easy to locate. However, progression within the paragraphs is sometimes unclear, and several ideas are joined in long, loosely connected sentences, particularly the list of location percentages. Linking is also repetitive, with “The pie chart” and “The bar graph” repeatedly introducing points rather than showing relationships between them. The phrase “In tap the small difference” signals a comparison, but the comparison could be expressed more clearly. Use shorter, controlled sentences and organise each chart paragraph from the largest or most important feature to the remaining details.
Lexical Resource: Band 5.0
You use relevant chart vocabulary, including “percentage,” “age groups,” “students,” and the names of the dance styles, so the topic is generally clear. However, the range is limited and several word choices or spellings make the description less precise, such as “area” for the share of classes, “max area,” and “dance accadimy.” Phrases such as “the dance class are divided into 4 parts” also describe the chart awkwardly rather than the data. Some expressions, including “small difference,” are understandable but could be more exact. Build a set of natural terms for reporting proportions and comparisons, and check spelling carefully; this will make the account clearer and more appropriately academic.
Grammatical Range and Accuracy: Band 5.0
You attempt both simple statements and longer sentences, but control is inconsistent. Subject–verb agreement errors occur in “the pie and bar graphs illustrates” and “these charts represents,” while articles and sentence structure are also problematic in “The pie chart represent the dance class.” The long sentence listing the location figures lacks clear punctuation and grammatical links, which makes the relationships harder to follow. There are also awkward constructions such as “in bullet 600 children have join under 11,” where the intended comparison is difficult to understand. Aim first for accurate, complete sentences with a clear subject and verb, then add variety through controlled clauses such as “whereas” and “while.”
See this exact question answered at other band scores. The same prompt compared across bands.
Browse more IELTS Writing model answers or get your own writing scored by the same AI examiner.