Band 5.5 IELTS Writing Task 1 Model Answer
Overall Band Score: 5.5 · Cambridge IELTS 19 · 2026-11-10
IELTS Writing Task 1 question
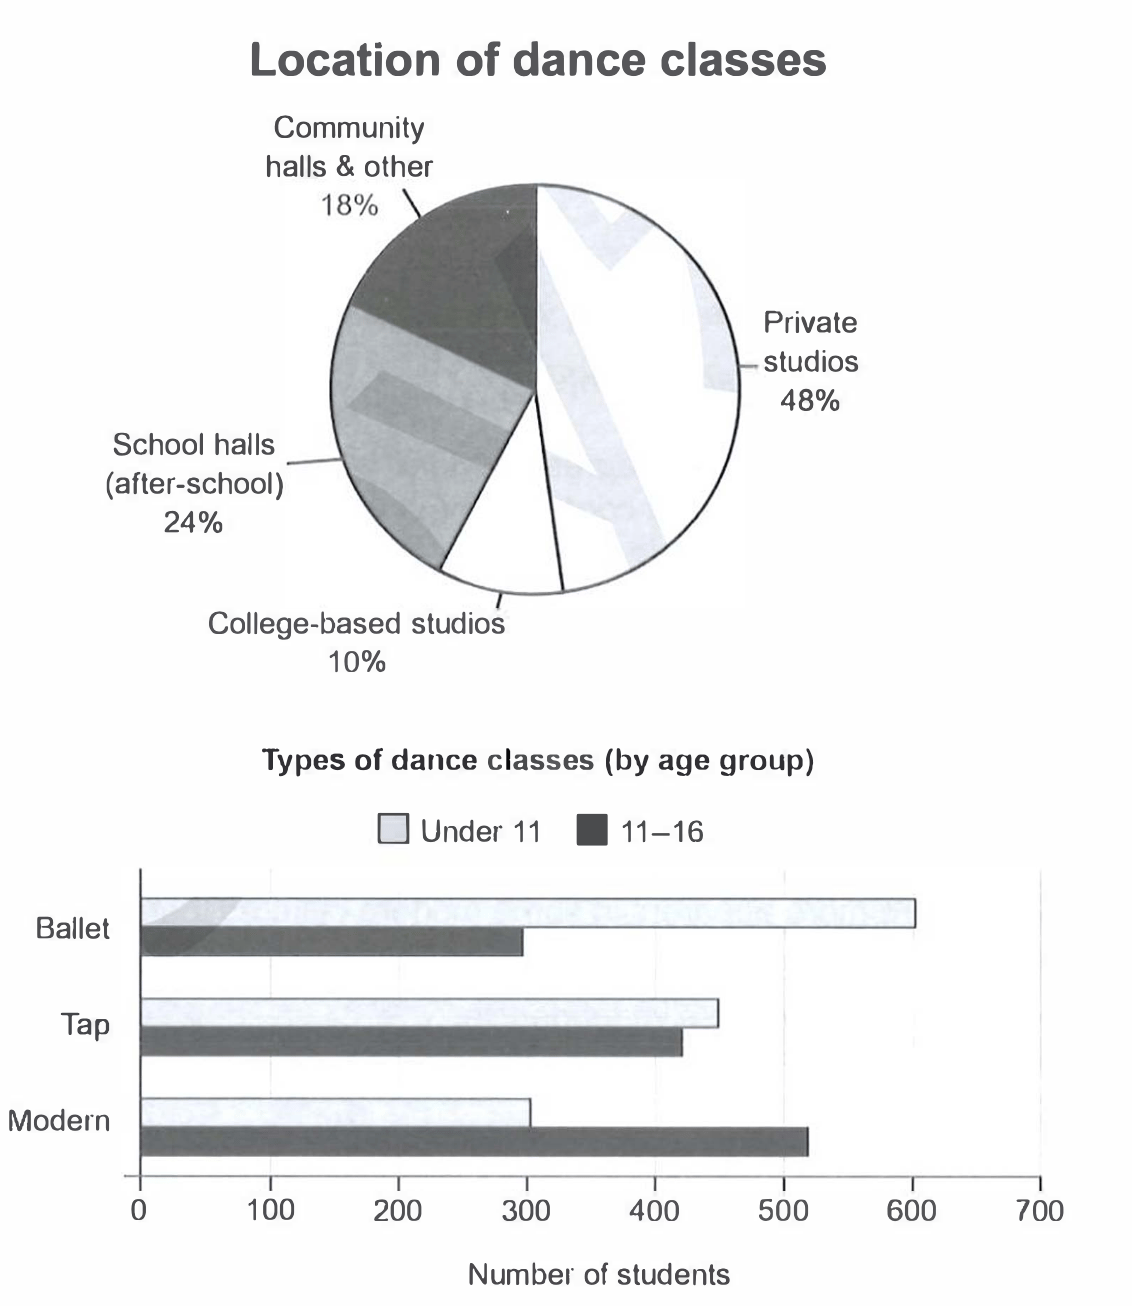
The charts below give information on the location and types of dance classes young people in a town in Australia are currently attending.
Summarise the information by selecting and reporting the main features, and make comparisons where relevant.
Student answer (Band 5.5)
Given graphs give data about the preference of people in dance catagories, in comaparison with location and age.
Their are two types of graph one is pivot chart, and other one is bar graph. First one gives information of location and the second tells about the dance types and the age group.
Most of the students select private studio for paratices, like percentage is around 48%. Second most famous are school halls its on 24%. Commiunity halls, and the least preference is college based studios, just 10 percent are attending classes in college.
In the second graph, under 11 kids are more intrested in ballet. Moreover, young ones from 11 to 16 are more in modren dance. Almost 600 pupils under 11 are enrolled in ballet and the number of youngsters are just 300. If we see the stats of tap then it looks quite similar in both groups, first line is on 420 and second is just near to 400. In modren dance more than 520 mature students are taking part and the graph of kids is on 300.
AI examiner evaluation
| Criterion | Band |
|---|---|
| Task Achievement / Task Response | 6.0 |
| Coherence and Cohesion | 6.0 |
| Lexical Resource | 5.0 |
| Grammatical Range and Accuracy | 5.5 |
| Overall | 5.5 |
Task Achievement / Task Response: Band 6.0
You identify the main patterns in both charts: private studios are the most common location, and ballet is more popular among under-11s while modern is more popular among 11–16-year-olds. Several figures are reported accurately, including 48%, 24%, and the ballet and modern comparisons. However, the overview is not clearly separated or fully developed, and some details are inaccurate or incomplete. You omit the 18% for community halls, and the tap figures are described as “420” and “just near to 400,” whereas the chart shows about 450 for under-11s and 420 for older students. A clearer summary of the key contrasts, with accurate figures for all three dance styles, would make the response more complete.
Coherence and Cohesion: Band 6.0
The response follows a generally sensible order: it introduces the two charts, discusses locations, and then moves to dance types. This makes the information reasonably easy to follow. You also use basic linking expressions such as “Moreover” and “If we see the stats,” although the latter is conversational and does not clearly signal a comparison. The opening spends space naming chart types rather than summarising the main features, and the final paragraph combines several comparisons without a clear progression. Some references, such as “first line” and “second,” are unclear because the reader must infer which age group each means. Organise the response into a concise overview and focused detail paragraphs, and use explicit labels such as “under-11 students” and “those aged 11–16.”
Lexical Resource: Band 5.0
You use some relevant vocabulary for describing charts, including “percentage,” “enrolled,” “preference,” and “taking part,” so the meaning is generally recoverable. However, the range is limited and several word choices or collocations are inaccurate or informal, such as “select … for paratices,” “most famous,” and “mature students” for the 11–16 age group. Spelling errors—including “catagories,” “comaparison,” “Commiunity,” “intrested,” and “modren”—are noticeable and reduce the precision of the report. Aim for standard chart language and check spelling carefully. Prefer neutral expressions such as “the most popular location” and “students aged 11–16,” rather than conversational or imprecise wording.
Grammatical Range and Accuracy: Band 5.5
You attempt both simple and more developed sentence forms, and most of the intended comparisons can be understood. However, some grammatical errors affect clarity and control. For example, “Their are two types of graph” has an incorrect subject form, while “Commiunity halls, and the least preference is college based studios” is a fragment rather than a complete sentence. In “Almost 600 pupils under 11 are enrolled in ballet and the number of youngsters are just 300,” the subject and verb do not agree in the second clause. There are also missing or awkward articles and sentence boundaries. Build complete sentences around each comparison, check singular and plural agreement, and use punctuation to separate related figures clearly.
See this exact question answered at other band scores. The same prompt compared across bands.
Browse more IELTS Writing model answers or get your own writing scored by the same AI examiner.