Band 5.0 IELTS Writing Task 1 Model Answer
Overall Band Score: 5.0 · Cambridge IELTS 19 · 2026-11-11
IELTS Writing Task 1 question
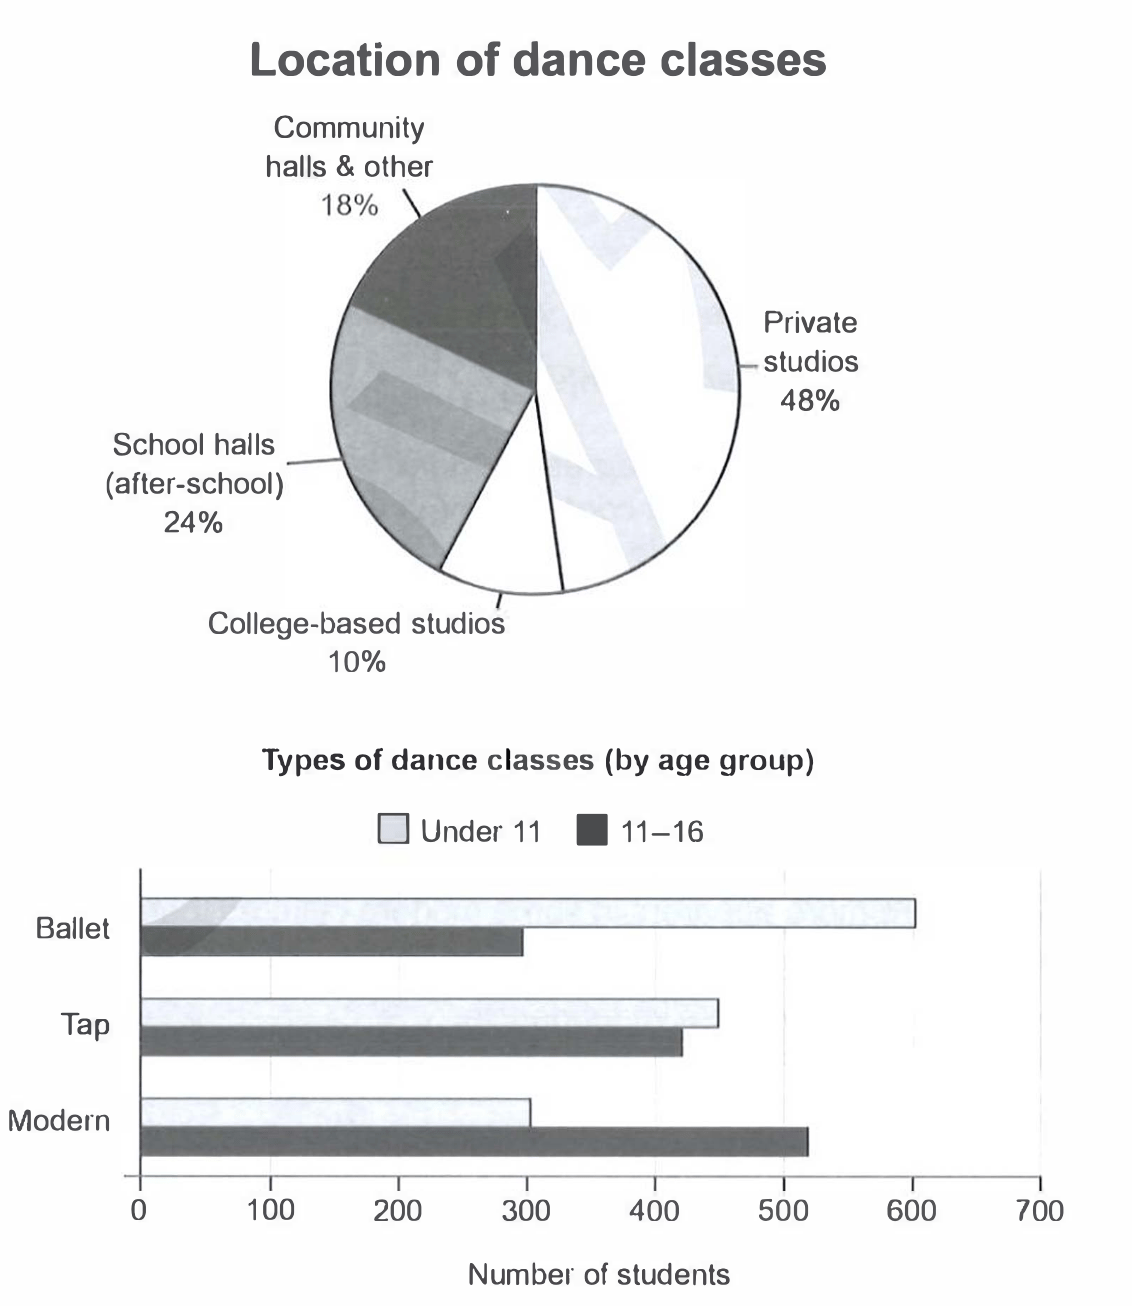
The charts below give information on the location and types of dance classes young people in a town in Australia are currently attending.
Summarise the information by selecting and reporting the main features, and make comparisons where relevant.
Student answer (Band 5.0)
The given pie chart illustrate the location of dance classes while the bar graph provides information about types of dance classes young people attend in a town of Australia.
Overall, Private studios accounted for a majority location for youths dance classes. Whereas Ballet dance is most preffered by students in a town of Australia.
Private studios make up the largest share for attending dance classes at 48%. School hall occupies 24% which is twice as high as college based studios. However community halls and others comprises moderate share at 1
AI examiner evaluation
| Criterion | Band |
|---|---|
| Task Achievement / Task Response | 4.0 |
| Coherence and Cohesion | 5.0 |
| Lexical Resource | 5.5 |
| Grammatical Range and Accuracy | 5.0 |
| Overall | 5.0 |
Task Achievement / Task Response: Band 4.0
You identify both chart types and report two accurate location figures: private studios at 48% and school halls at 24%, correctly noting that the latter is half the former. However, the response addresses the task only minimally: the location description is cut off at “1”, and the bar chart is not described with any figures or comparisons. The overview also says ballet is most preferred overall, but the chart shows different leading styles by age group: ballet for under-11s and modern for 11–16-year-olds. The response is 60 words below the required minimum, which leaves the main features substantially incomplete. To improve, complete the location data and compare the dance types and age groups using the chart’s key figures.
Coherence and Cohesion: Band 5.0
There is a basic attempt to organise the response: an introduction is followed by an overview and then a detail paragraph. This gives the reader a recognisable starting structure. However, the progression stops abruptly, with the final sentence ending at “1”, and there is no paragraph or transition addressing the bar chart. The linking word “Whereas” is used as a sentence fragment after the overview, rather than connecting two complete ideas. “However” also does not clearly signal a contrast in the following location detail. Develop a separate paragraph for the age-group comparisons and use clear links such as “By contrast” or “Meanwhile” where the data genuinely contrasts.
Lexical Resource: Band 5.5
The response uses some relevant chart vocabulary, including “pie chart”, “bar graph”, “accounted for”, and “share”, so the topic is generally clear. However, the range is limited and several choices are inaccurate or awkward, such as “majority location” and “most preffered”; the latter also contains a spelling error. “Moderate share” is vague when the chart provides an exact percentage, and the final phrase “at 1” is incomplete. Use precise reporting language and the chart’s terminology to describe proportions and comparisons. For example, “largest proportion” is more natural than “majority location”, while “most popular among” is clearer than “most preffered”.
Grammatical Range and Accuracy: Band 5.0
You attempt both simple and more developed sentence forms, including “School hall occupies 24% which is twice as high as college based studios.” However, grammatical control is uneven. The opening sentence has subject–verb disagreement (“pie chart illustrate”), and “Whereas Ballet dance is…” is an incomplete dependent clause. There are also errors in number and agreement in “community halls and others comprises”, while the final sentence is unfinished. These problems sometimes make the intended relationships difficult to follow. Practise checking subject–verb agreement and ensure each sentence has a complete main clause. A clearer version of the comparison would be: “School halls account for 24%, twice the proportion for college-based studios.”
See this exact question answered at other band scores. The same prompt compared across bands.
Browse more IELTS Writing model answers or get your own writing scored by the same AI examiner.