Band 5.5 IELTS Writing Task 1 Model Answer
Overall Band Score: 5.5 · Cambridge IELTS 19 · 2026-11-12
IELTS Writing Task 1 question
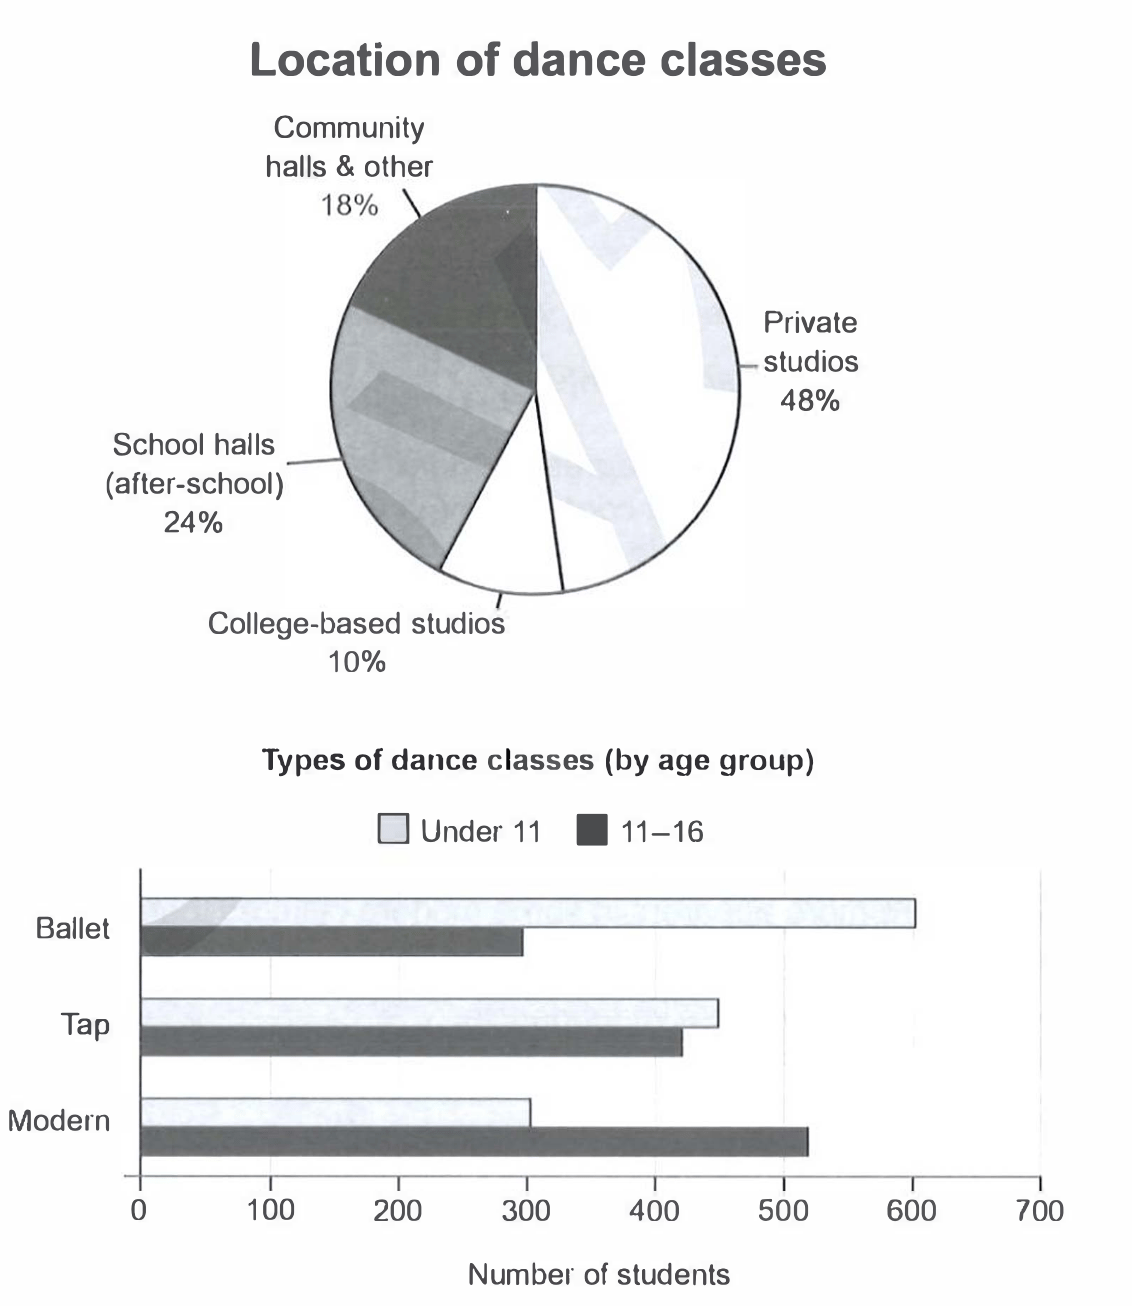
The charts below give information on the location and types of dance classes young people in a town in Australia are currently attending.
Summarise the information by selecting and reporting the main features, and make comparisons where relevant.
Student answer (Band 5.5)
The pie chart and bar chart below illustrates the location and types of dance classes of young indivisuals currently attending in a town in Australia.
Overall, In the pie chart the proportion of private studio dominate overother four categorie, While college based studio occupies the samllest proportion. In bar chart childs under eleven dominates in the ballet dance class while in modern the number of childs age under eleven shows the lowest.
In the pie chart the heighest proportion are the private studios which are 48 percent. The top location in community hall and other are 18 percent it is the second larger portion of pie chart, while the school halls the percentage is 24 percent.
In bar chart children under 11 range from 300 to 600 in different type of dance classes in ballet its value is highest which is round about to 610. In tap thenumber are slightly decrease to around 450 while in modern the number of dance classes sharply decreased to 300 it is the smallest portion of bar chart.
AI examiner evaluation
| Criterion | Band |
|---|---|
| Task Achievement / Task Response | 5.5 |
| Coherence and Cohesion | 6.0 |
| Lexical Resource | 5.5 |
| Grammatical Range and Accuracy | 5.0 |
| Overall | 5.5 |
Task Achievement / Task Response: Band 5.5
You identify the main location category correctly: private studios account for 48%, and you note that college-based studios have the smallest share, although you do not give that figure. You also describe the under-11 pattern across ballet, tap and modern with broadly accurate values. However, the report is only partial because it omits the figures for the 11–16 group, an important part of the bar chart, and does not compare the two age groups. The overview also says private studios dominate “over other four categorie,” though the chart has four categories in total. Include the older group’s pattern—modern is highest at about 520—and compare it with the under-11 figures to make the key features more complete.
Coherence and Cohesion: Band 6.0
The response has a recognisable structure: an introduction and overview are followed by separate discussion of the pie chart and bar chart. This makes the information reasonably easy to follow. However, progression within the report is limited, and the bar-chart paragraph covers only one age group, so the comparison between the two series is missing. Some linking is repetitive or mechanical, particularly the repeated use of “while” and “In the pie chart.” Referencing is also occasionally unclear, as in “the top location in community hall and other,” where the intended ranking is not expressed smoothly. Organise the body around the main comparisons and use clearer links such as “by contrast” or “whereas” to guide the reader.
Lexical Resource: Band 5.5
You use some relevant chart vocabulary, including “proportion,” “percentage,” “range,” and “decreased,” which helps communicate the subject. However, the range is limited and several word-choice, collocation and spelling problems make parts awkward or unclear. Examples include “the top location in community hall and other,” “second larger portion,” and “the smallest portion of bar chart.” There are also noticeable spelling errors such as “indivisuals,” “categorie,” and “heighest.” Use precise terms for chart data: a category has a “share” or “percentage,” while a student count is a “figure” or “number.” Proofreading spelling and choosing natural collocations would make the report clearer.
Grammatical Range and Accuracy: Band 5.0
The response attempts both simple and more extended sentences, including a contrast in the overview and a sequence describing the under-11 figures. However, control is inconsistent, and errors sometimes make the relationships between ideas difficult to follow. For example, “The pie chart and bar chart below illustrates” has a subject–verb agreement error, while “In the pie chart the heighest proportion are the private studios” has a mismatch between the singular subject and verb. Sentence boundaries and punctuation also need attention: the overview joins several claims with commas, and “In tap thenumber are slightly decrease” contains faulty sentence structure and verb form. Practise accurate agreement and verb forms, and separate related points into complete sentences.
See this exact question answered at other band scores. The same prompt compared across bands.
Browse more IELTS Writing model answers or get your own writing scored by the same AI examiner.