Band 5.0 IELTS Writing Task 1 Model Answer
Overall Band Score: 5.0 · Cambridge IELTS 19 · 2026-11-12
IELTS Writing Task 1 question
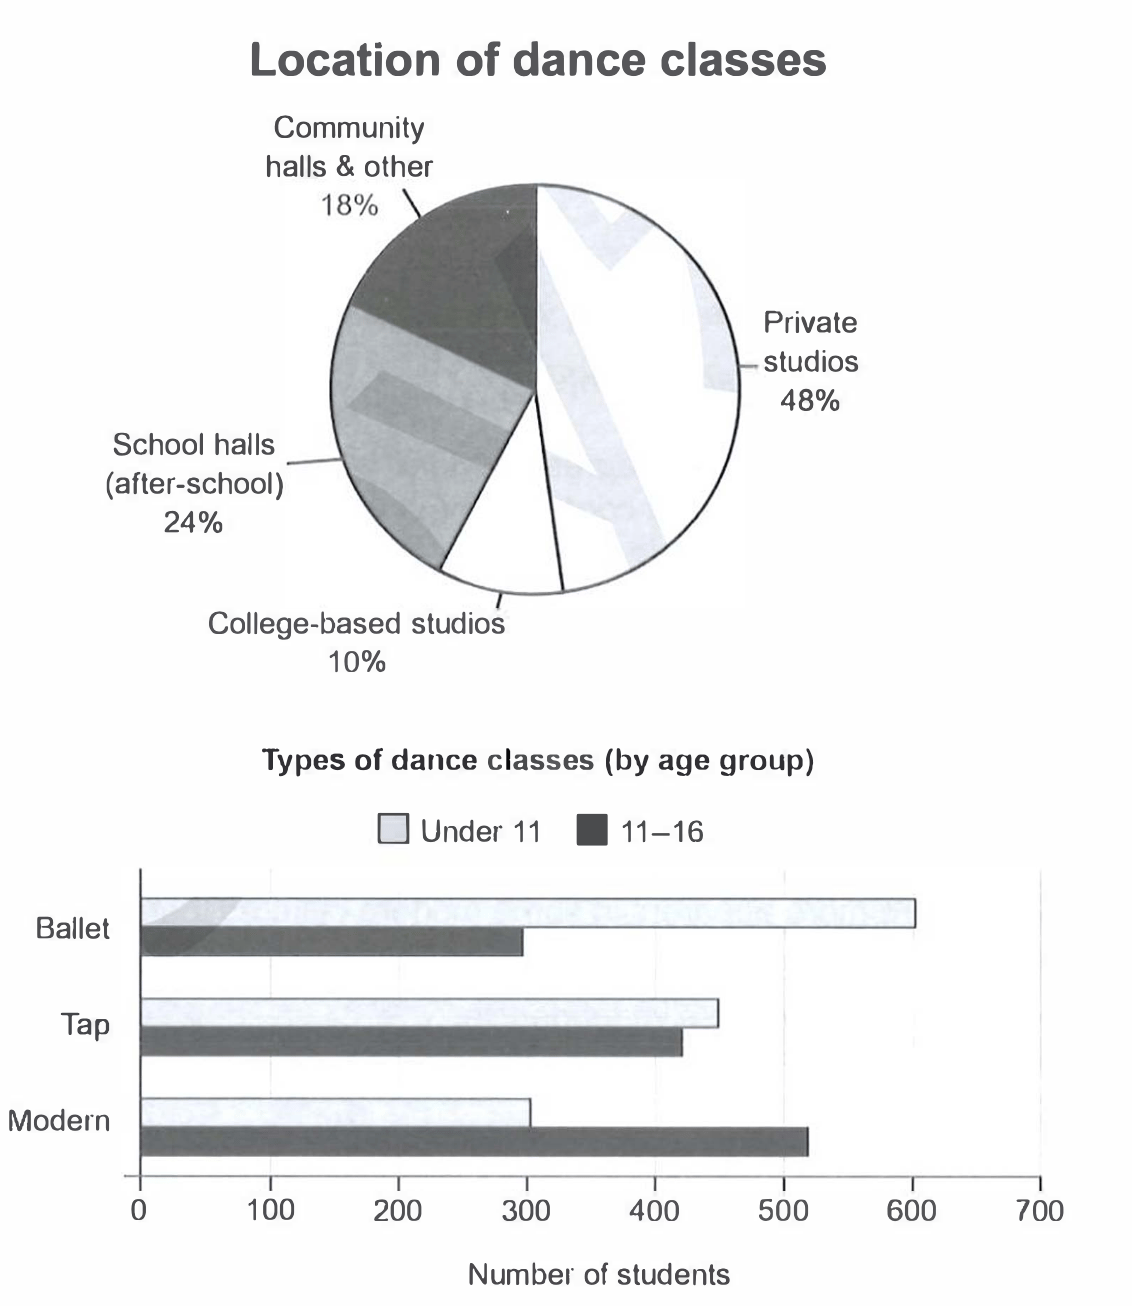
The charts below give information on the location and types of dance classes young people in a town in Australia are currently attending.
Summarise the information by selecting and reporting the main features, and make comparisons where relevant.
Student answer (Band 5.0)
The pie chart illustrates the information of the distribution of dance classes by location,with four categories. The largest portion belongs to private studios and the smallest share is college based studios.
Teenagers in a town in Australia are currently participating in four dance classes and they are divided by their age groups. Number of young people who are fall in under 11 are prioratized the ballet dance and tap dance the most the numbers is 600 and 450 students respectivally. Kids who are lying under 11-16 age group attending modern dance session the most with 520 approximately in addition tap dance classes in the second place. Both of the charts shows that
AI examiner evaluation
| Criterion | Band |
|---|---|
| Task Achievement / Task Response | 4.5 |
| Coherence and Cohesion | 4.5 |
| Lexical Resource | 5.5 |
| Grammatical Range and Accuracy | 5.0 |
| Overall | 5.0 |
Task Achievement / Task Response: Band 4.5
You identify the largest and smallest location categories correctly: private studios account for 48%, while college-based studios make up 10%. You also report two accurate figures for the under-11 group. However, the response only partially covers the charts: it omits the other location percentages and gives an incomplete comparison of all three dance styles across both age groups. The statement that young people attend “four dance classes” is not supported by the chart, which shows three styles. The overview is unfinished (“Both of the charts shows that”), and the response is 38 words below the required minimum. Include a complete overview and select the main comparisons from both charts to develop a fuller summary.
Coherence and Cohesion: Band 4.5
There is a basic attempt to organise the response, beginning with the pie chart and then moving to the age-group data. This gives the reader some sense of the two chart topics. However, the progression is difficult to follow because the second paragraph combines several comparisons in a long, unclear sequence, and the final sentence stops before completing its point. Linking phrases such as “in addition” and “in the second place” do not clearly show how the figures relate. Separate the charts into clearly focused paragraphs, use a concise overview between the introduction and details, and ensure each comparison is complete. Clearer referencing would also help readers identify which age group each figure describes.
Lexical Resource: Band 5.5
You use some task-relevant vocabulary, including “distribution,” “largest portion,” “smallest share,” and “age groups,” which helps communicate the general subject. There is also some variation in how you refer to the data, such as “participating” and “attending.” However, several word choices and collocations are inaccurate or awkward, including “information of the distribution,” “are fall in,” and “prioratized the ballet dance.” Spelling errors such as “respectivally” and “prioratized” also reduce precision. Aim for standard chart-reporting phrases and check spelling carefully; for example, use “the proportion of classes held at” and “the most popular style among” to describe the data more naturally.
Grammatical Range and Accuracy: Band 5.0
The response attempts both simple statements and longer sentences, and the opening sentence communicates a clear basic idea. However, control is inconsistent, particularly in the longer sentence about the under-11 group: “Number of young people who are fall in under 11 are prioratized…” has problems with sentence structure, verb forms, and agreement. The phrase “Kids who are lying under 11-16 age group attending” also lacks a correctly formed verb phrase and article. The final clause, “Both of the charts shows that,” is incomplete and has subject–verb disagreement. Use shorter, complete sentences first, checking that each has a clear subject and verb, then build comparisons with accurate clauses.
See this exact question answered at other band scores. The same prompt compared across bands.
Browse more IELTS Writing model answers or get your own writing scored by the same AI examiner.