Band 6.0 IELTS Writing Task 1 Model Answer
Overall Band Score: 6.0 · Cambridge IELTS 19 · 2026-11-14
IELTS Writing Task 1 question
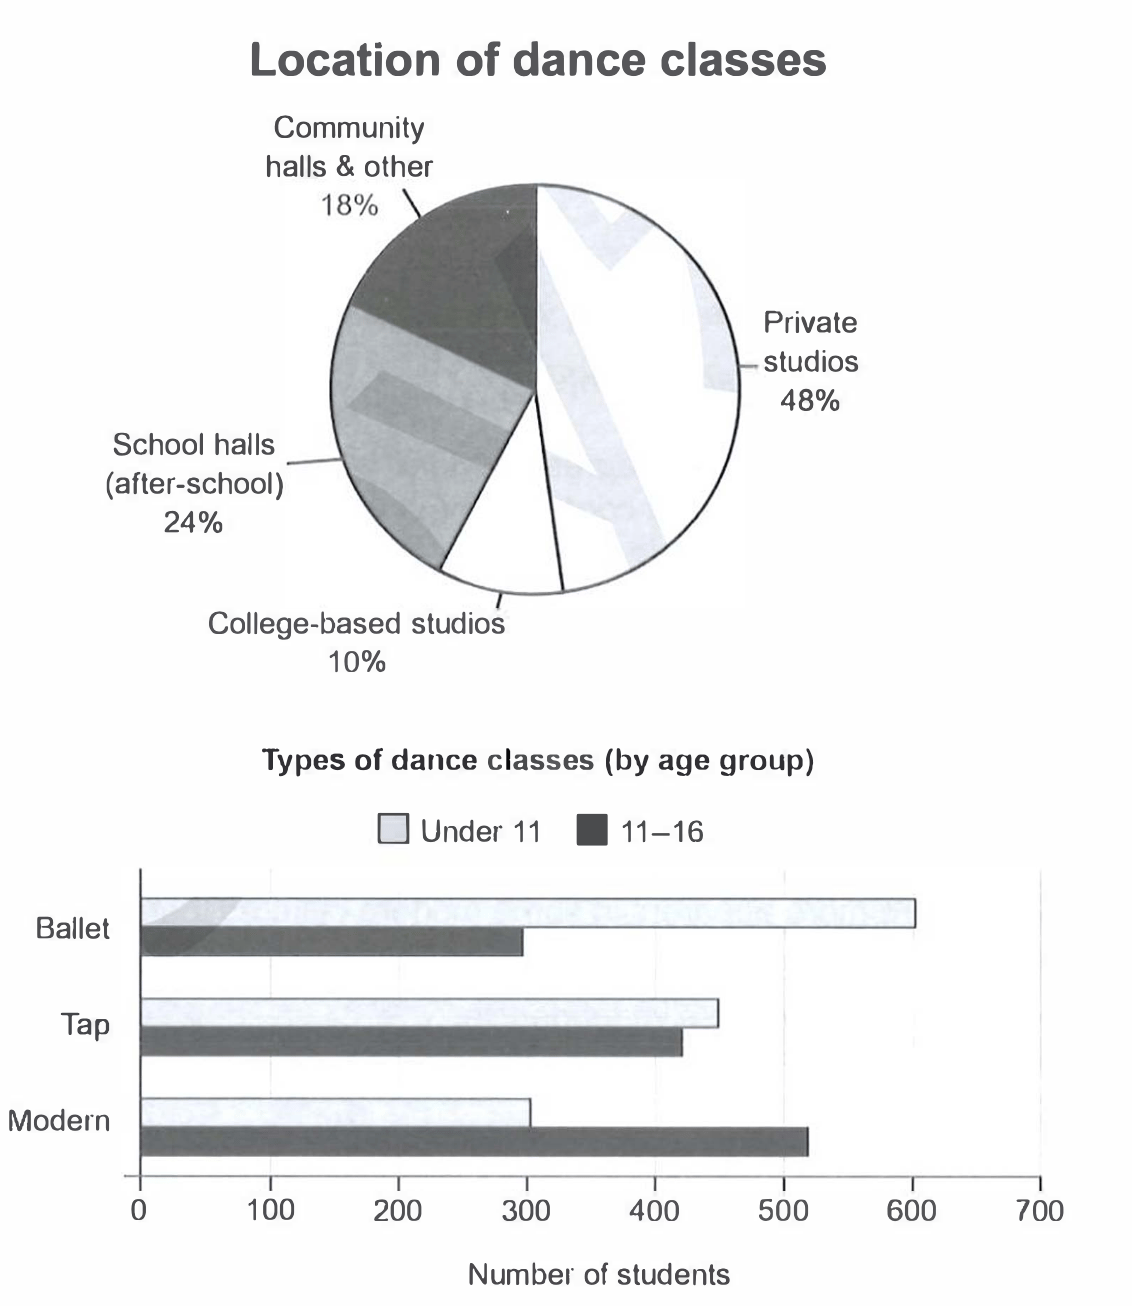
The charts below give information on the location and types of dance classes young people in a town in Australia are currently attending.
Summarise the information by selecting and reporting the main features, and make comparisons where relevant.
Student answer (Band 6.0)
Two charts illustrate the comparison between location and types of dance classes among young individuals in a town in Australia.
Overall, In pie chart the private studios shares the highest proportion while college-based studios account lowest shares. On the other hand, bar graph depicts the types of dance class and here the ballet dance represents mounted trends among youngsters whereas, it depicts lowest trends among teens.
Apparently, pie chart shares the location for dance classes included school halls, community halls, private studios and the college based studios. Private studios depicts the highest trends with 48% of student go there to attend the class. Conversly, the college based studio gathers only 10% of students and it is the lowest percentage in the pie chart. Moreover, school halls shows better proportion with 24% as compare to community halls and college based studios. As, community halls share 18% of proportion, which is neither the higher nor the lowest among other locations.
Moving further, the bar graph shows two age groups such as under 11 and 11 to 16. Here are three categories of dance involved included with ballet, tap and modern. In the category of ballet dance both groups depicts different trends such as 600 student of under 11 group joined ballet whereas, half of its number of student of 11 to 16 groups joined this category. Furthermore, fluctuation in other categories could be seen.
AI examiner evaluation
| Criterion | Band |
|---|---|
| Task Achievement / Task Response | 6.0 |
| Coherence and Cohesion | 6.5 |
| Lexical Resource | 5.5 |
| Grammatical Range and Accuracy | 5.5 |
| Overall | 6.0 |
Task Achievement / Task Response: Band 6.0
You identify the main location pattern accurately: private studios are highest at 48%, and college-based studios are lowest at 10%; the other two shares are also reported correctly. You also introduce both age groups and all three dance styles. However, the overview’s claim that ballet is the leading trend among youngsters is too broad: ballet is highest only for under-11s, while modern is highest among 11–16-year-olds. The bar-chart discussion then gives only the ballet comparison and says merely that there is “fluctuation” in the other categories, without reporting the key contrasts: tap is similar across ages, while modern is more popular with older students. Develop these comparisons to make coverage of the two charts more balanced and precise.
Coherence and Cohesion: Band 6.5
The response has a clear overall arrangement: an introduction, an overview, and separate paragraphs for the pie chart and bar chart. This gives the reader a coherent route through the information, and transitions such as “Moreover” and “Moving further” signal progression. The organisation is not yet consistently effective, however. The final paragraph ends with the vague statement “fluctuation in other categories could be seen,” so the discussion feels unfinished rather than progressing through the data. Some linking is also mechanical or awkward, as in “On the other hand” and “As,” where the relationship between ideas is not clear. Use direct comparisons within the age groups and connect them with precise links such as “whereas” or “by contrast.”
Lexical Resource: Band 5.5
You use a reasonable range of topic vocabulary, including “proportion,” “categories,” “college-based studios,” and “age groups,” and the chart information is generally understandable. However, several repeated or imprecise expressions weaken naturalness and precision. “Depicts the highest trends” is not an appropriate collocation for a percentage, and “mounted trends” does not clearly describe the figures. “Fluctuation” is also unsuitable here because the chart compares student numbers rather than changes over time. There are spelling and form errors, including “Conversly,” and repeated use of “shares” where “accounts for” or “represents” would be more natural. Aim for accurate chart language and avoid using elevated-sounding words when a simpler term is clearer.
Grammatical Range and Accuracy: Band 5.5
You attempt a mix of simple and more complex sentences, including comparisons with “whereas” and clauses introduced by “while.” The main figures can usually be understood, but some grammatical errors recur. For example, “the private studios shares” has subject–verb disagreement, and “48% of student go there” has problems with both number and verb agreement. The sentence beginning “As, community halls share 18%” is incorrectly punctuated and does not form a complete, well-connected structure. Capitalisation is also inconsistent in “Overall, In pie chart.” Improve control of articles, plural nouns, agreement, and sentence boundaries; then check each longer sentence to ensure its clauses are joined correctly.
See this exact question answered at other band scores. The same prompt compared across bands.
Browse more IELTS Writing model answers or get your own writing scored by the same AI examiner.