Band 5.5 IELTS Writing Task 1 Model Answer
Overall Band Score: 5.5 · Cambridge IELTS 19 · 2026-11-15
IELTS Writing Task 1 question
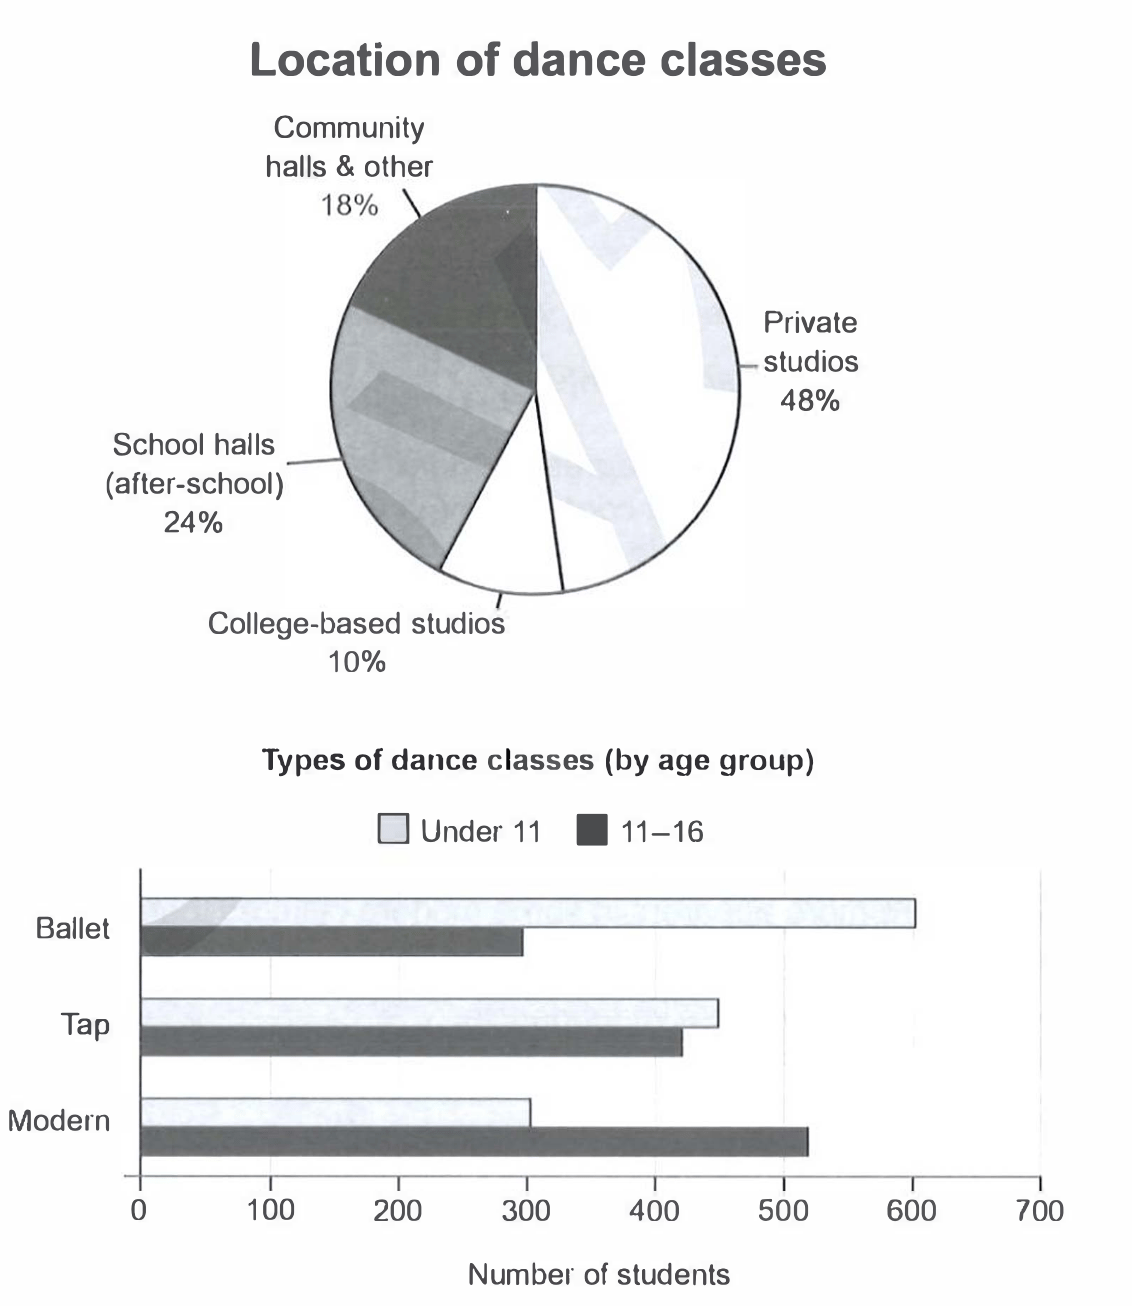
The charts below give information on the location and types of dance classes young people in a town in Australia are currently attending.
Summarise the information by selecting and reporting the main features, and make comparisons where relevant.
Student answer (Band 5.5)
The pie chart shows that youth living in a place of Australia are currently attending different dance classes as well as shows their location of dance classes. Three types of dance classes include ballet tap modern.
Location include community halls, private studios, school halls, collage based studios. However, almost covers 48% area of the total location. Community halls and school halls have a slightly difference that community covers 18% area while schools covers 24% area. Similarly, location of collage based studios have a covering area of 10%.
The bar graph represent types of dance classes with respect to age group. Modern ages like under 11 have maximum number of 300 students and modern ages like 11 to 16 have 500 students in a class. Tap ages for under 11 as well as 11 to 16 have almost similar strength between 400 and 500 students. Ballet ages of under 11 have 600 students and for 11 to 16 ages have 300 students which create a big difference between these ages.
AI examiner evaluation
| Criterion | Band |
|---|---|
| Task Achievement / Task Response | 5.0 |
| Coherence and Cohesion | 6.0 |
| Lexical Resource | 5.0 |
| Grammatical Range and Accuracy | 5.0 |
| Overall | 5.5 |
Task Achievement / Task Response: Band 5.0
You identify both charts and report several relevant figures, including the 48% share for private studios and the contrast between ballet participation by age group. However, the response only partly summarises the main features: it does not give a clear overall overview of the most important patterns, such as private studios being the largest location and college-based studios the smallest, or the shift from ballet among younger children to modern among older students. Some details are inaccurate or unclear: the older group’s modern figure is about 520, not 500, and saying “modern ages” confuses the dance style with the age group. Develop the key comparisons more clearly and ensure each figure is accurately linked to its category.
Coherence and Cohesion: Band 6.0
The response has a generally understandable order: it introduces the charts, discusses locations, and then moves to dance types by age. This gives the reader a basic framework, and phrases such as “Similarly” and “while” help connect some comparisons. However, the progression is not consistently clear because the opening repeats the task rather than presenting an overview, and several sentences contain unclear references, such as “However, almost covers 48% area” and “Modern ages like under 11.” The paragraphing also does little to distinguish the main overview from supporting details. Use a clear overview followed by one paragraph for location and one for age-group comparisons, with precise links between each category and its figures.
Lexical Resource: Band 5.0
You use relevant chart vocabulary, including “pie chart,” “bar graph,” “age group,” “students,” and “percentage” figures, so the topic is generally recognisable. However, the range is limited and several word choices or collocations make the meaning difficult to follow. For example, “covers 48% area” is not a natural way to describe a share, “strength” is unsuitable for student numbers, and “modern ages” incorrectly combines the dance style with age. There are also spelling errors in “collage” for “college.” Aim for precise reporting language such as “accounts for,” “participation,” and “the 11–16 age group,” and check spelling of chart labels.
Grammatical Range and Accuracy: Band 5.0
You attempt both simple statements and longer comparisons, for example, “Ballet ages of under 11 have 600 students and for 11 to 16 ages have 300 students.” This shows an effort to combine information, but the range of sentence structures remains limited and errors are frequent enough to make some sentences hard to interpret. Examples include “The pie chart shows … as well as shows,” where the verb structure is not parallel, and “Community halls and school halls have a slightly difference,” where the article and adjective form are incorrect. Subject–verb agreement and sentence construction also need attention in “The bar graph represent.” Practise accurate chart-reporting patterns, such as “The bar chart shows that…” and “There were approximately…,” before adding more complex comparisons.
See this exact question answered at other band scores. The same prompt compared across bands.
Browse more IELTS Writing model answers or get your own writing scored by the same AI examiner.