Band 6.5 IELTS Writing Task 1 Model Answer
Overall Band Score: 6.5 · Cambridge IELTS 19 · 2026-11-17
IELTS Writing Task 1 question
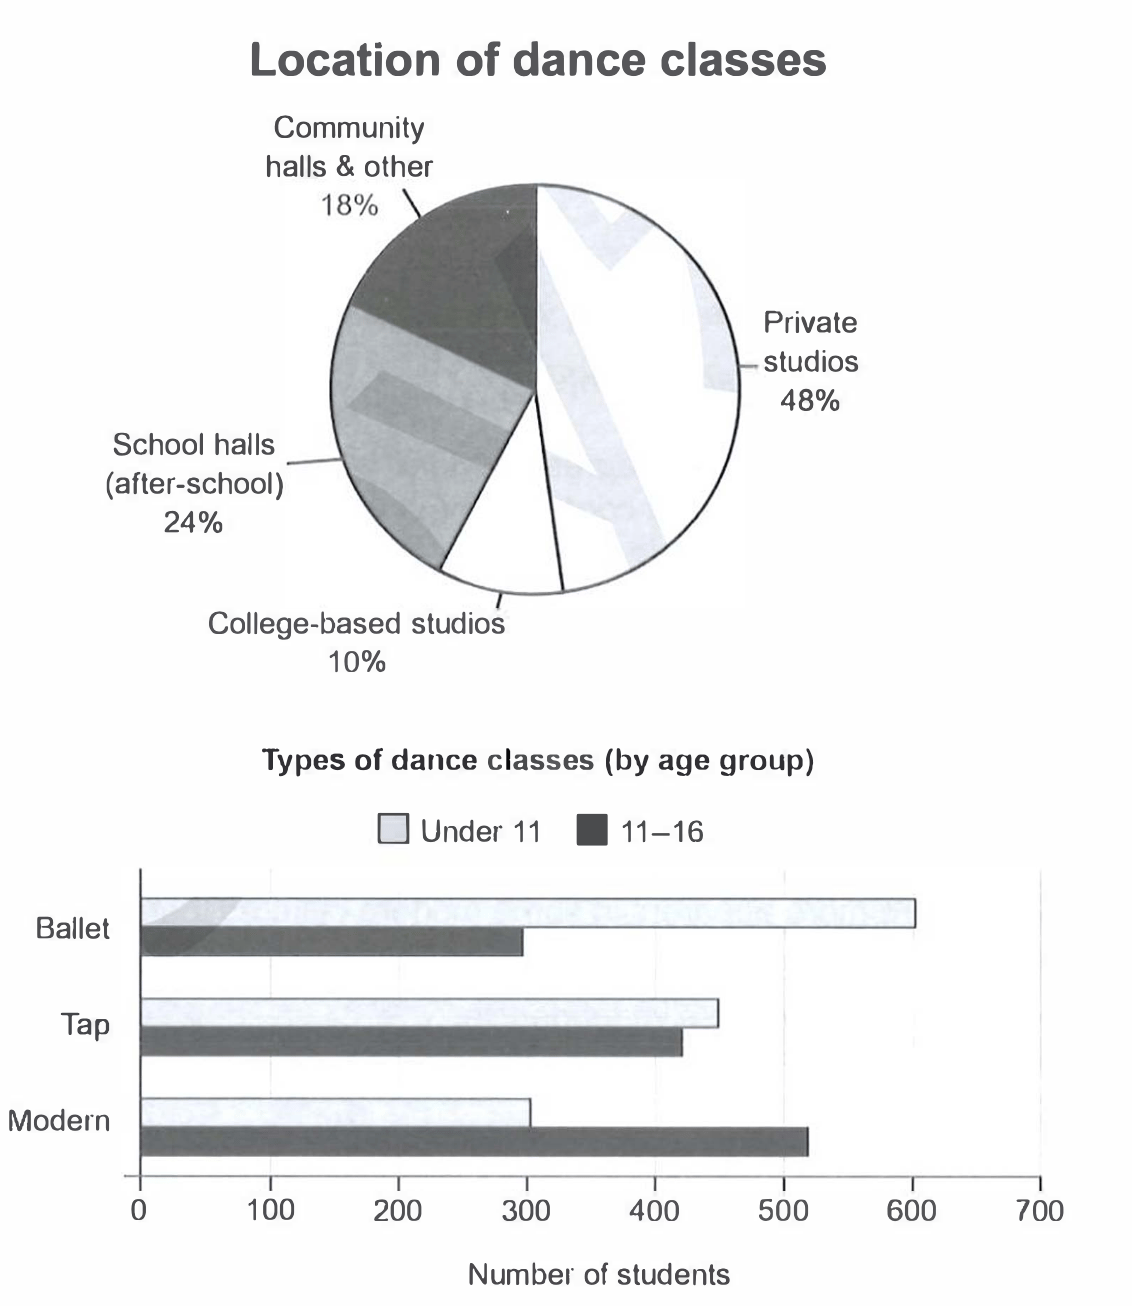
The charts below give information on the location and types of dance classes young people in a town in Australia are currently attending.
Summarise the information by selecting and reporting the main features, and make comparisons where relevant.
Student answer (Band 6.5)
The pie chart show the places where young people in a town in australia go for dance classes, and the bar chat shows the type of dance classes they take by age group.
Overall, Private studios are the most popular place for dance classes. Also ballet is the most popular dance for children under 11, While modren dance is most popular in the age group of 11-16.
Almost half of pie chart is covered by private studios which is about 48%, most of the students attend their classe in private studios, after-school hall classes stands on the second stage with 24%. Community halls and other classes make up with 18%, While college-based studios have the smallest number at 10%.
For the types of dances, arround 600 childern under 11 do ballet, compared to 300 students 11-16 age group. Tap dance have similar number of students in both age group. 435 young students and 425 older student. Finally, modren dance is taken by about 520 older students, but only 300children under 11.
AI examiner evaluation
| Criterion | Band |
|---|---|
| Task Achievement / Task Response | 7.0 |
| Coherence and Cohesion | 7.0 |
| Lexical Resource | 5.5 |
| Grammatical Range and Accuracy | 5.5 |
| Overall | 6.5 |
Task Achievement / Task Response: Band 7.0
You cover both charts and provide a clear overview of the main contrasts: private studios account for the largest share of locations, ballet leads among under-11s, and modern dance leads among 11–16-year-olds. The location figures are reported accurately, and your comparisons for ballet and modern dance reflect the chart. You also identify tap as similar across the age groups, which is a useful comparison. However, the overview could be more complete by noting that the older group’s tap figure is also substantial and that the leading dance style changes with age. The tap figures you give (435 and 425) are close to the chart, though the approximate values are about 450 and 420. Overall, the key information is selected and supported, with some scope for a more precise overview.
Coherence and Cohesion: Band 7.0
The response has a clear four-part structure: an introduction, an overview, a paragraph on class locations, and one on dance types. Information progresses logically from the general picture to specific figures, and linking expressions such as “Overall,” “Also,” “For the types of dances,” and “Finally” help guide the reader. Comparisons are generally placed together, making the data easy to follow. To make the organisation more polished, use transitions that express the relationship between figures rather than relying mainly on sequencing words. For example, the ballet and modern comparisons could be linked directly to show how preferences differ by age. Capitalisation after commas and consistent punctuation would also make the presentation smoother.
Lexical Resource: Band 5.5
You use relevant vocabulary for describing charts, including “most popular,” “make up,” “smallest number,” and “compared to,” so the main information is understandable. There is some useful variation in how you describe proportions and student numbers. However, the range is limited and several spelling errors are noticeable, including “chat,” “modren,” “arround,” and “childern.” Some expressions are also imprecise or unnatural, such as “covered by private studios,” “stands on the second stage,” and “make up with 18%.” Choose standard chart language such as “accounts for,” “ranks second,” and “represent.” More accurate spelling and collocations would make the report clearer and more appropriately formal.
Grammatical Range and Accuracy: Band 5.5
You communicate the main comparisons using both simple sentences and some more developed structures, including “which is about 48%” and “compared to 300 students.” The overall meaning remains clear, but grammatical control is uneven. For example, “The pie chart show” needs subject–verb agreement, while “Tap dance have” should use a singular verb. In “most of the students attend their classe,” the possessive and plural form are not controlled, and “300children” needs a space. Capitalisation and punctuation are also inconsistent, particularly in “While” after a comma. Practise checking agreement, articles, plurals, and sentence boundaries; more consistently accurate sentence patterns would strengthen the report.
See this exact question answered at other band scores. The same prompt compared across bands.
Browse more IELTS Writing model answers or get your own writing scored by the same AI examiner.