Band 5.5 IELTS Writing Task 1 Model Answer
Overall Band Score: 5.5 · Cambridge IELTS 19 · 2026-11-17
IELTS Writing Task 1 question
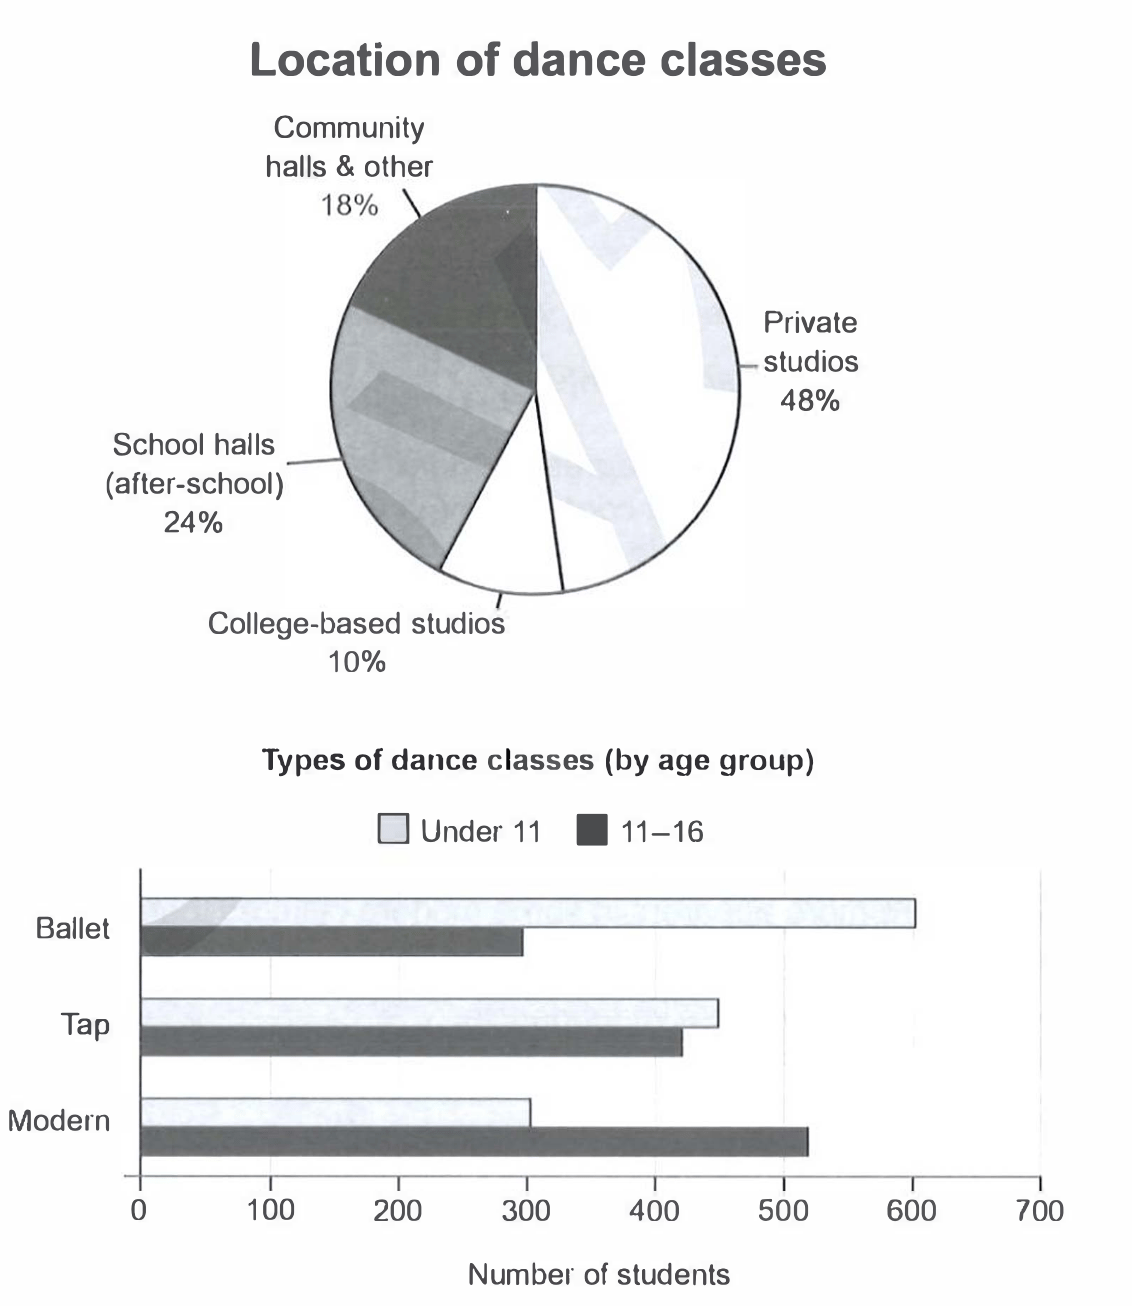
The charts below give information on the location and types of dance classes young people in a town in Australia are currently attending.
Summarise the information by selecting and reporting the main features, and make comparisons where relevant.
Student answer (Band 5.5)
The pie chart illustrates the location of dance classes and the bar graph compares the types of dance classes currently attending by a number of students in a town of Australia.
Overall, private studios have the higher proportion in the pie chart followed by school halls, community halls and college based studios which is the lowest while in bar graph the ballet is peformed for higher proportion of students under 11 and the 11-16 age group students performed ballet which is a lower proportion.
In the piechart, private studios occupy a higher proportion of dance classes which is 48% followed by school halls and school halls which accounted for 24% and 18% respectively. Also college based studios occupy a lower proportion of dance classes which is 10%.
In the bar graph, ballet is performed significantly higher by a number of students who are under 11 which is around 600 followed by tap and modern which accounted for 450 and 300 students which is the lowest proportion. The age group of students which are 11-16 have the highest proportion of [redacted phone] and 400 students.
AI examiner evaluation
| Criterion | Band |
|---|---|
| Task Achievement / Task Response | 5.5 |
| Coherence and Cohesion | 6.0 |
| Lexical Resource | 5.5 |
| Grammatical Range and Accuracy | 5.5 |
| Overall | 5.5 |
Task Achievement / Task Response: Band 5.5
You identify the two chart types and report several relevant figures, including the 48% share for private studios and the under-11 figures for ballet, tap and modern. The overview also recognises that ballet is most popular among younger students. However, some key comparisons are missing or unclear: the older group’s figures are not accurately reported, and the statement that these students have the “highest proportion of 200-300 and 400 students” does not convey the chart’s values (about 300 for ballet, 420 for tap and 520 for modern). You also repeat “school halls” where the 18% category is community halls and other. To strengthen the response, give a clear overview of the contrasting age-group preferences and report the main figures accurately.
Coherence and Cohesion: Band 6.0
The response has a recognisable structure: an introduction, an overview, and separate paragraphs for the pie chart and bar graph. This makes the two visual elements easy to locate, and linking phrases such as “Overall,” “followed by” and “Also” help connect information. However, progression within the overview and final paragraph is weakened by unclear phrasing, particularly “the highest proportion of 200-300 and 400 students,” which makes the comparison difficult to follow. The repeated use of “which” also creates awkward links between ideas. Organise the bar-chart details by age group and use clearer comparisons, such as contrasting the younger group’s preference for ballet with older students’ preference for modern.
Lexical Resource: Band 5.5
You use relevant chart vocabulary, including “proportion,” “accounted for,” “followed by” and “age group,” so the topic is generally clear. However, several choices are inaccurate or repetitive. “Ballet is performed” describes an action rather than the popularity of a class, and “higher proportion of students” is not suitable when the bar chart gives numbers of students. “School halls and school halls” repeats a category instead of naming community halls, while “piechart” and “peformed” show spelling or form errors. Aim for precise reporting language such as “was attended by” or “the number of students taking,” and vary “higher” with terms such as “largest” or “most popular.”
Grammatical Range and Accuracy: Band 5.5
You attempt both simple and more extended sentences, and the overall meaning is usually recoverable. Some grammatical errors, however, make comparisons unclear. In “private studios have the higher proportion … followed by school halls, community halls and college based studios which is the lowest,” the singular “is” does not agree with the plural list, and the clause structure is difficult to follow. “The age group of students which are 11-16 have” also has faulty agreement and an awkward relative clause. The final sentence lacks a clear grammatical structure for presenting the three figures. Use direct constructions such as “Students aged 11–16 recorded…” and check subject–verb agreement and sentence boundaries.
See this exact question answered at other band scores. The same prompt compared across bands.
Browse more IELTS Writing model answers or get your own writing scored by the same AI examiner.