Band 5.5 IELTS Writing Task 1 Model Answer
Overall Band Score: 5.5 · Cambridge IELTS 19 · 2026-11-18
IELTS Writing Task 1 question
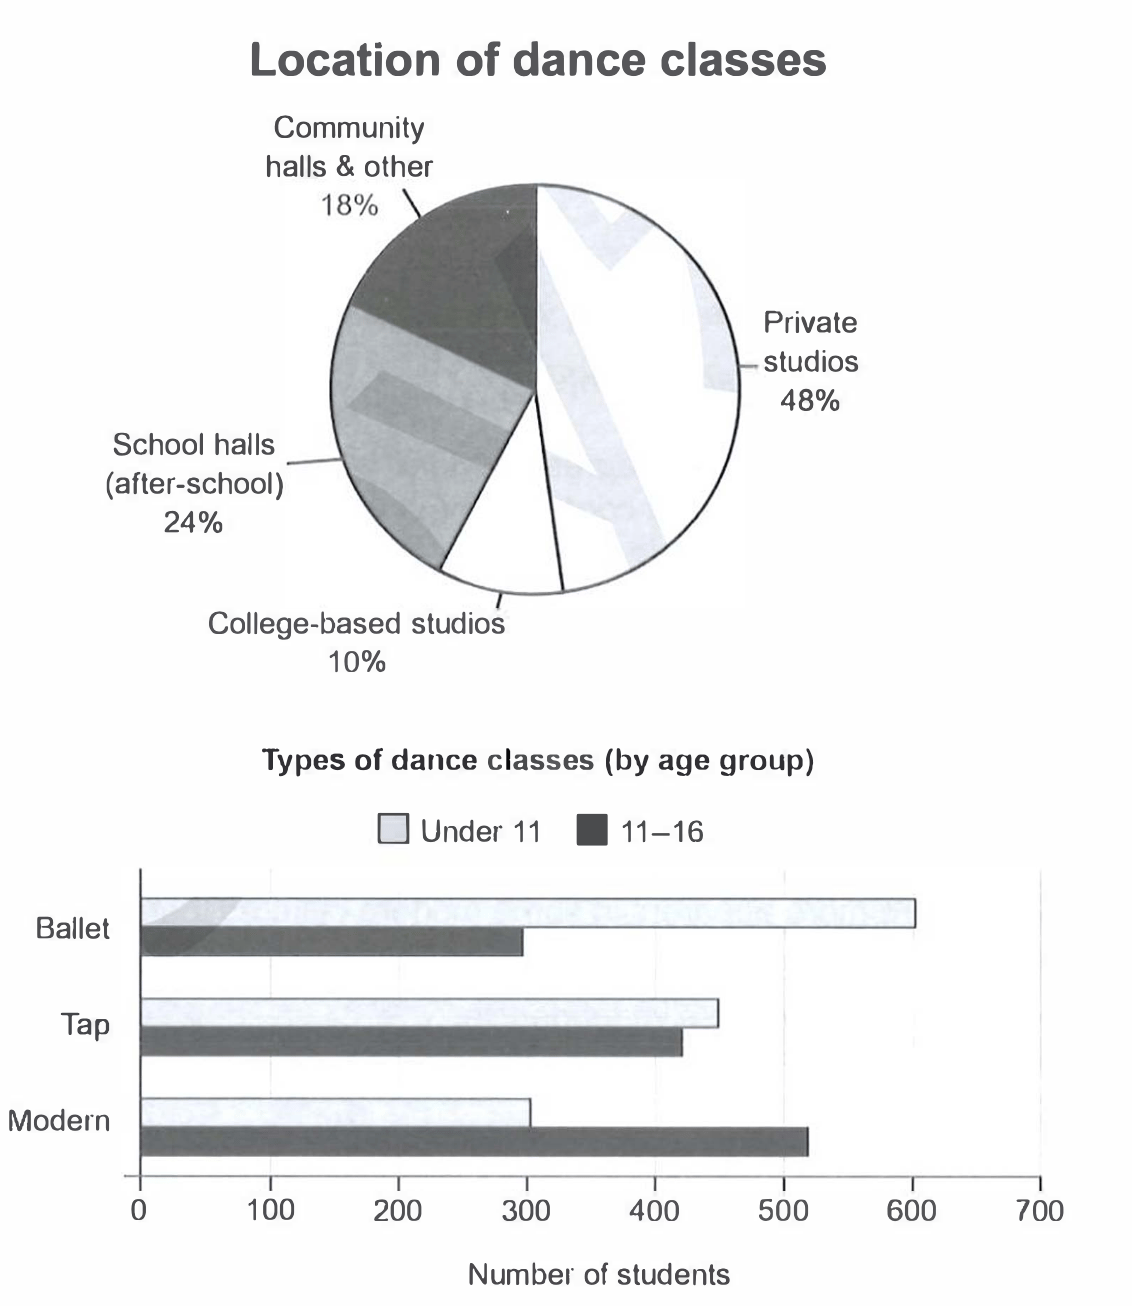
The charts below give information on the location and types of dance classes young people in a town in Australia are currently attending.
Summarise the information by selecting and reporting the main features, and make comparisons where relevant.
Student answer (Band 5.5)
The pie chart illustartes information on the location of dance classes and bar chart provides infromation about the types of dance classes of young people participates in a town of Australia.
Overall, it is clear that the proportion classes take place in private studios were higher and college based studios were lower, whereas under eleven aged participates more in ballet classes and younger students participates more in modern dance classes.
The pie chart provide information about the location of dance classes the private studios accounted for higher porportion at 48% as compared to school halls about 24%.Whereas community halls and other showed lower proportion at 18% and college based studios recorded the most least location for dance classes at about 10%.
As compared to the types of dance classes by age group under 11 accounted higher in ballet at 600 number of students as compared to 11 to 16 aged groups at 300. Whereas in tap classes both aged groups were almost same 400 to 450, followed by modern classes showed higher numbers of 11 to 16 aged groups at 510 and under 11 recorded the least number about 300.
AI examiner evaluation
| Criterion | Band |
|---|---|
| Task Achievement / Task Response | 6.0 |
| Coherence and Cohesion | 6.0 |
| Lexical Resource | 5.5 |
| Grammatical Range and Accuracy | 5.0 |
| Overall | 5.5 |
Task Achievement / Task Response: Band 6.0
You cover both charts and identify the main location pattern: private studios are the largest share (48%) and college-based studios the smallest (10%). You also report the key age-group contrasts in ballet and modern, and note that tap figures are similar. These are relevant comparisons and support a clear overview. However, the overview contains a factual contradiction: it says younger students participate more in modern, while the chart shows the 11–16 group has more students in modern (about 520 versus 300). The tap comparison is also imprecise: the figures are about 450 and 420, rather than simply “400 to 450.” More precise, consistently checked comparisons would make the summary more complete and clear.
Coherence and Cohesion: Band 6.0
The response has a clear overall structure: an introduction, an overview, and separate paragraphs for the location and age-group charts. This makes the information easy to follow, and comparisons such as ballet versus modern help connect the figures. Cohesion is less successful within some sentences, however. Repeated use of “whereas” creates a mechanical effect, and the sentence beginning “The pie chart provide information…” repeats the introduction rather than moving directly to the data. The overview’s conflicting statement about modern classes also interrupts the logical progression. Use a wider range of linking methods, and ensure each sentence develops a distinct point; clearer punctuation between comparisons would help the relationships read smoothly.
Lexical Resource: Band 5.5
You use relevant chart vocabulary, including “proportion,” “accounted for,” “recorded,” and “age group,” so the reader can understand the topic and most comparisons. However, several word-choice and collocation problems reduce precision: “the most least location” is not a natural expression, “higher proportion” needs an article or a more suitable construction, and “young people participates” uses an unsuitable form. There are also spelling errors in “illustartes” and “infromation.” Aim for accurate, natural phrases such as “the smallest share” and “the largest proportion,” and proofread spelling and word forms. This would make the vocabulary more controlled and appropriate for describing data.
Grammatical Range and Accuracy: Band 5.0
You attempt a mixture of simple statements and longer comparisons, including sentences with “whereas” and “as compared to.” Some relationships are understandable, but grammatical errors occur across the response. For example, “the pie chart provide” has subject–verb disagreement, while “young people participates” and “younger students participates” also have incorrect agreement. The opening sentence lacks a clear grammatical structure around “bar chart provides,” and punctuation is missing after “24%,” causing the next comparison to run on. Work on subject–verb agreement, articles, and sentence boundaries, then check each longer sentence for a complete, correctly connected structure. These changes would improve accuracy while preserving your attempts at complex comparisons.
See this exact question answered at other band scores. The same prompt compared across bands.
Browse more IELTS Writing model answers or get your own writing scored by the same AI examiner.