Band 5.5 IELTS Writing Task 1 Model Answer
Overall Band Score: 5.5 · Cambridge IELTS 20 · 2026-11-05
IELTS Writing Task 1 question
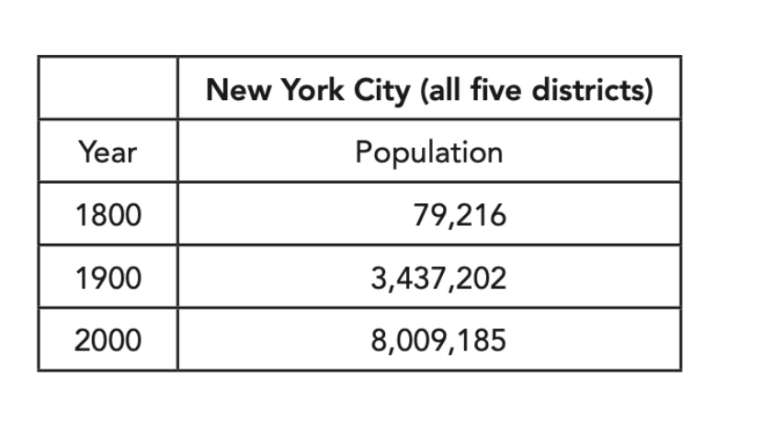
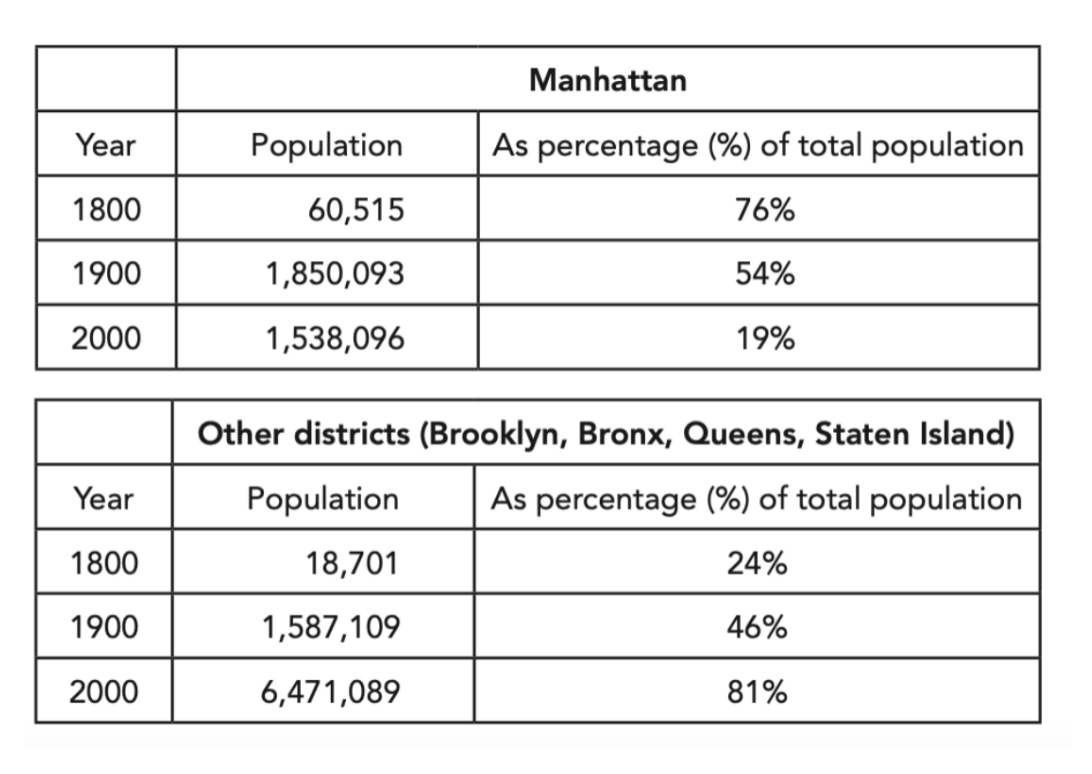
The first table below shows changes in the total population of New York City from 1800 to 2000. The second and third tables show changes in the population of the five districts of the city (Manhattan, Brooklyn, Bronx, Queens, Staten Island) over the same period.
Summarise the information by selecting and reporting the main features, and make comparisons where relevant.
Student answer (Band 5.5)
The first table shows the poulation increase in New York city over a century as shows in the year 1800 the population was seventy nine thousand which massively turned to thirty-four lacs over next century in 1900 and it turns out to be more than doubled in the year 2000.
The next tables shows comparsion of various districs of New york city over the century starting from the year 1800 Manhattan shows the drop in percenage of total population from 76% to 19% while the other districts incuding Brooklyn, Bronx, Queens, Staten Island shows increase in total popultion from 24% to 81% over the next 2 centuries from year1800 to 1900,This massive population increase in New York city from the year 1800 to 1900 should be studied,weather it is asociated with increasing birth rate or due to massive immigrantion.
Population shift from big districts like Manhattan to other districs shows better standards of living or employment.
AI examiner evaluation
| Criterion | Band |
|---|---|
| Task Achievement / Task Response | 5.5 |
| Coherence and Cohesion | 5.5 |
| Lexical Resource | 5.0 |
| Grammatical Range and Accuracy | 5.0 |
| Overall | 5.5 |
Task Achievement / Task Response: Band 5.5
You identify the broad trends: New York’s population grew substantially, while Manhattan’s share fell and the other districts’ share rose. However, the account is only partly complete and includes an important time-period error: the change from 24% to 81% is described as occurring from 1800 to 1900, although 81% is the figure for 2000. The total population is also described imprecisely as “thirty-four lacs” in 1900, and “more than doubled” in 2000 is not supported with the actual figure or a clear comparison. The final comments about immigration, birth rates, living standards and employment are speculation rather than information shown in the tables. Focus on accurate comparisons across all three dates and give a concise overview grounded in the data.
Coherence and Cohesion: Band 5.5
The response has a basic sequence, moving from the citywide population table to the district figures, and phrases such as “The first table” and “The next tables” help signal this shift. However, the ideas do not develop in a consistently clear order: the district comparison is followed by speculation about causes and then possible explanations for population movement. These comments interrupt the summary rather than extending the data description. Some linking is also awkward or unclear, particularly the long sentence beginning “The next tables shows comparison,” which combines several trends and a time reference. Organise the response into a clear overview and focused detail, and use links to show accurate time comparisons rather than joining unrelated points.
Lexical Resource: Band 5.0
You attempt some task-relevant vocabulary, including “population,” “percentage,” “increase,” “drop,” and “population shift,” so the main subject is generally understandable. However, the range is limited and several spelling and word-choice errors make the account less precise: “poulation,” “comparsion,” “districs,” “percenage,” and “immigrantion.” Phrases such as “massively turned” and “thirty-four lacs” are also unsuitable or unclear in this formal data summary. Choose standard, precise expressions for describing figures and trends, such as “rose to,” “accounted for,” and “declined in share.” Proofreading spelling and using consistent numerical language would make your comparisons easier to follow.
Grammatical Range and Accuracy: Band 5.0
The response attempts to connect ideas in longer sentences, but control is inconsistent, and several sentences contain errors that make relationships between ideas difficult to follow. For example, “The first table shows the poulation increase … as shows in the year 1800” has a faulty clause structure, while “The next tables shows” has subject–verb disagreement. The sentence about the district shares runs together after “1900,” with a comma splice and unclear punctuation. Tense and sentence construction also become unreliable in “it turns out to be more than doubled.” Use shorter, complete sentences to report each comparison, check agreement and verb forms, and separate the data summary from any concluding comment.
See this exact question answered at other band scores. The same prompt compared across bands.
Browse more IELTS Writing model answers or get your own writing scored by the same AI examiner.