Band 5.5 IELTS Writing Task 1 Model Answer
Overall Band Score: 5.5 · Cambridge IELTS 20 · 2026-11-05
IELTS Writing Task 1 question
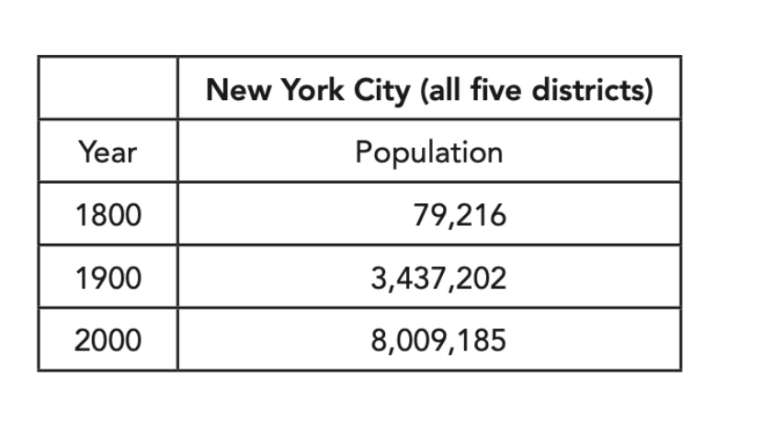
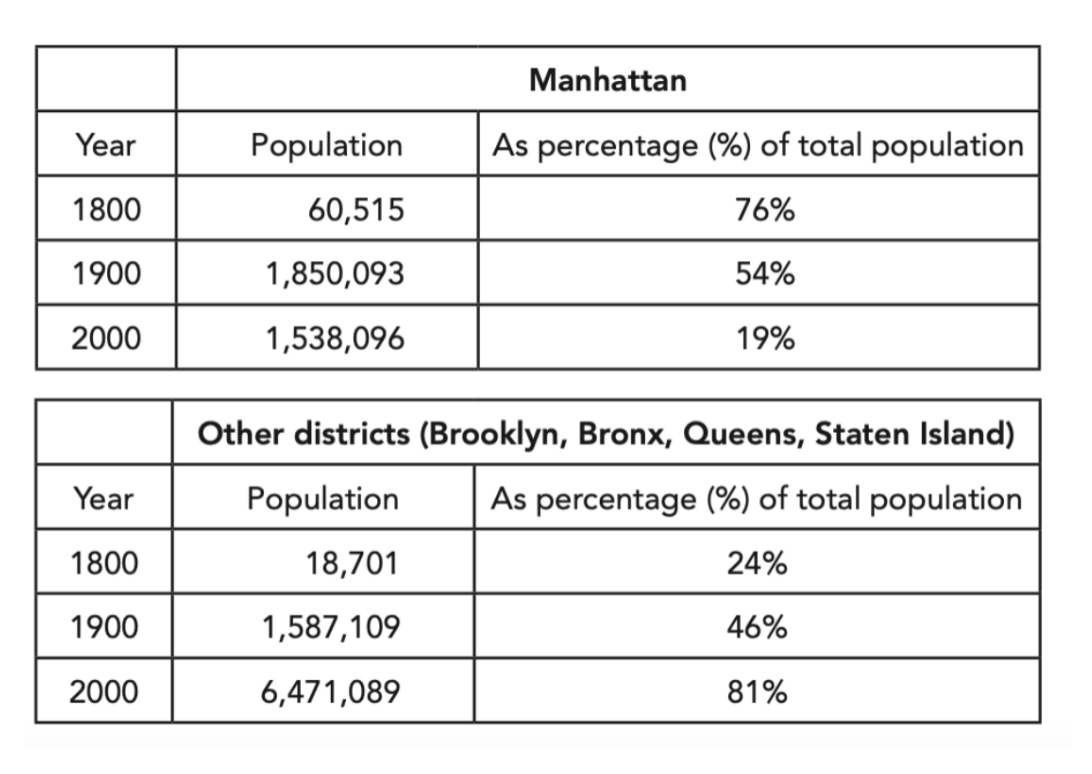
The first table below shows changes in the total population of New York City from 1800 to 2000. The second and third tables show changes in the population of the five districts of the city (Manhattan, Brooklyn, Bronx, Queens, Staten Island) over the same period.
Summarise the information by selecting and reporting the main features, and make comparisons where relevant.
Student answer (Band 5.5)
The table compares the proportion in the total population of New York City and further devides the population in smaller table for analyzing the changes in five districts from 1800 to 2000.
Overall, the population of NY significantly increased from 1800 to 2000. A noticable change had taken place, population of Manhattan moved to the others four city and maintained the ratio of total population.
From the table of total city's population of NY in 1800, the population of the city was 79216 and it rised at [redacted phone], which was appoximately 100 times greater than before. Maximum population moved from Manhattan city to others. In 1800, the city fostered 76% of the total population but in 2000 it gradually fall down to 19%, which was a noticable change.
The other four districts maintained the proportion of the total population with the Manhattan.The four together gave shelter only 24% of the total in 1800 while in 2000 it raised the limit to 81% that's mean every city approximately captured the similar ratio and it was around 20%.
AI examiner evaluation
| Criterion | Band |
|---|---|
| Task Achievement / Task Response | 6.0 |
| Coherence and Cohesion | 5.5 |
| Lexical Resource | 5.0 |
| Grammatical Range and Accuracy | 5.0 |
| Overall | 5.5 |
Task Achievement / Task Response: Band 6.0
You identify the main overall change: New York City’s population rose substantially, while Manhattan’s share fell and the other districts’ combined share grew. The figures you give for 1800 and 2000 broadly match the tables, and the comparison between Manhattan’s 76% and 19% is relevant. However, the overview is unclear when it says Manhattan’s population “moved” to the other districts; the tables show changing population shares, not people relocating. Coverage is also uneven: you omit the 1900 figures, including the fact that Manhattan’s population peaked then before declining by 2000, and you do not report the combined population figures for the other districts. Clarify the distinction between population totals and percentages, and select the key changes across all three years.
Coherence and Cohesion: Band 5.5
The response has a recognisable structure, with an introduction, an overview and paragraphs describing the total population and district shares. This gives the reader a basic route through the information. However, progression is weakened by unclear links between ideas. For example, “maintained the ratio of total population” conflicts with the later description of the shares changing from 24% to 81%, and “The other four districts maintained the proportion … with the Manhattan” is difficult to interpret. The final claim that each district captured a similar ratio is not clearly connected to the table. Use clearer topic sentences and refer consistently to the combined share of the four districts; organise the comparisons by year or by Manhattan versus the other districts.
Lexical Resource: Band 5.0
You attempt a range of vocabulary relevant to describing data, including “significantly increased,” “proportion,” “gradually,” and “approximately.” However, several word choices or collocations are inaccurate or unclear, such as “population moved,” “fostered 76%,” “raised the limit,” and “gave shelter.” These expressions make the data description less precise. There are also noticeable spelling errors, including “devides,” “noticable,” “rised,” and “appoximately.” Aim for standard chart-reporting language and check spelling carefully. Terms such as “accounted for,” “share,” “rose,” and “declined” would help you describe the figures accurately without implying movement or shelter.
Grammatical Range and Accuracy: Band 5.0
You use both simple statements and some longer sentence forms, including a comparison with “but” and a clause introduced by “which.” However, control is inconsistent, and errors sometimes make relationships between ideas hard to follow. For example, “it rised at 8009185” has an incorrect verb form and an unclear preposition, while “it gradually fall down to 19%” has a tense error. In “The other four districts maintained the proportion … with the Manhattan,” the sentence structure does not clearly express the comparison. Work on past-tense forms, articles, and complete, well-linked clauses. Shorter sentences that state one comparison at a time would improve accuracy while you build confidence with complex structures.
See this exact question answered at other band scores. The same prompt compared across bands.
Browse more IELTS Writing model answers or get your own writing scored by the same AI examiner.