Band 6.0 IELTS Writing Task 1 Model Answer
Overall Band Score: 6.0 · Cambridge IELTS 20 · 2026-11-06
IELTS Writing Task 1 question
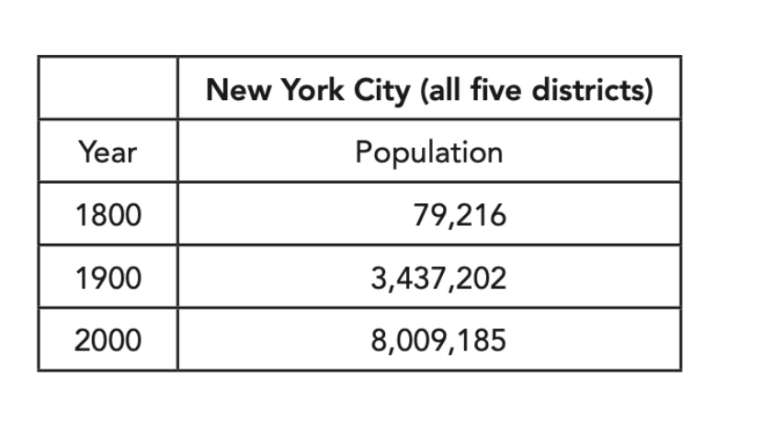
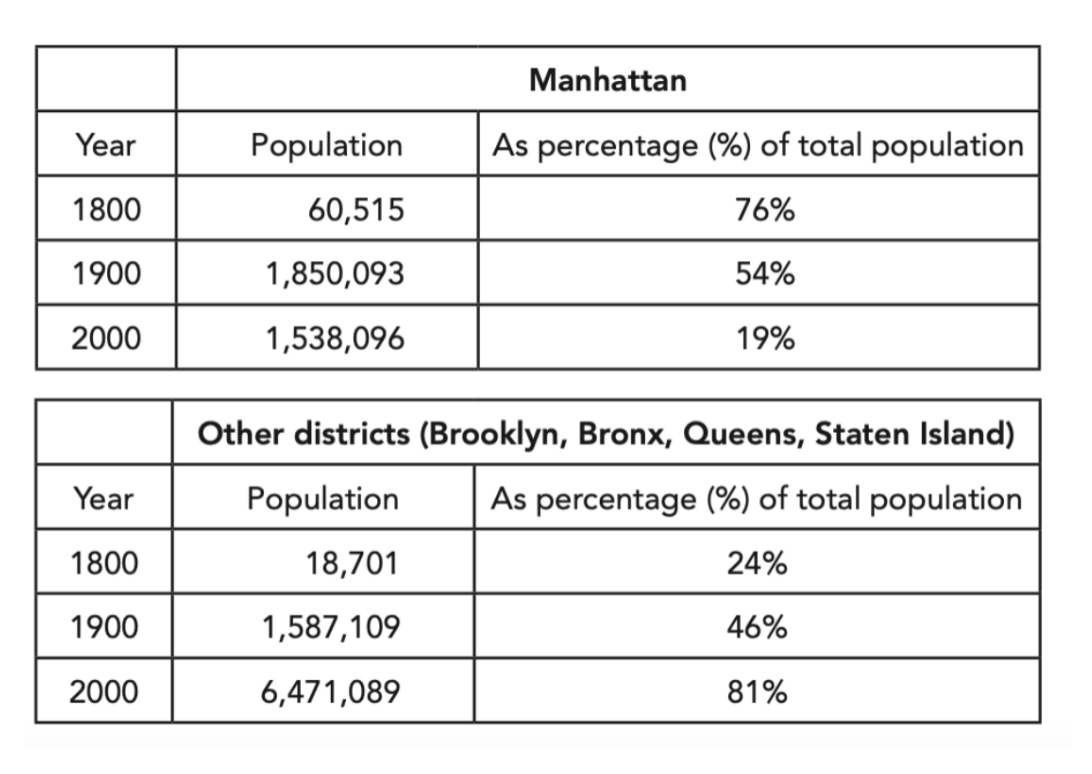
The first table below shows changes in the total population of New York City from 1800 to 2000. The second and third tables show changes in the population of the five districts of the city (Manhattan, Brooklyn, Bronx, Queens, Staten Island) over the same period.
Summarise the information by selecting and reporting the main features, and make comparisons where relevant.
Student answer (Band 6.0)
The first table illustrates the fluctuations in the total population of New York city from 1800 to 2000, whereas second and third tables give information about changes in population of five different districts of the city.
Overall, the city experienced considerable rise in population in 2000. The Manhattan district's contribution to the city's population was higher in year 1800 , whereas other four district's accounted for the largest contribution ratio in the city' population in the year 2000.
New York city had the lowest population in year 1800. Population was only 79,216 but in 1900, it increased significantly and turned into 3,437,202. A dramatic rise was again recorded in the population in year 2000. The total number was 8,000,185, higher among all years.
Manhattan district's contribution to city's poulation was 76% in the year 1800, accounting for the highest proportion. Than it fell to 54% in 1900 and in 2000, Manhattan contribution was declined a lot, only 19% of the total poulation. Population of other four districts Brooklyn, Bronx, Queens and Staten Island went through gradual increase throughout the period. In 1800, the percentage was 24%, in 1900, its was 46% and in 2000 it was 81% of the total population.
AI examiner evaluation
| Criterion | Band |
|---|---|
| Task Achievement / Task Response | 6.0 |
| Coherence and Cohesion | 6.5 |
| Lexical Resource | 6.0 |
| Grammatical Range and Accuracy | 5.5 |
| Overall | 6.0 |
Task Achievement / Task Response: Band 6.0
You cover the main comparisons: the city’s total population rose substantially, Manhattan’s share fell, and the other districts’ share increased. The overview identifies the shift in which group accounted for the larger proportion, and the figures for 1800 and 1900 are reported accurately. However, the 2000 total is given as 8,000,185 rather than 8,009,185. Also, the response focuses on percentage shares for the districts and gives little detail about their actual populations, despite these being shown in the table. The statement that the other districts increased “throughout the period” is supported, but the overview could more clearly distinguish Manhattan’s population peak in 1900 from its decline by 2000. More precise coverage of both population and share would strengthen the summary.
Coherence and Cohesion: Band 6.5
The response has a clear overall arrangement: an introduction, an overview, and separate paragraphs for the city total and district comparisons. This makes the information easy to follow, and linking expressions such as “whereas,” “Overall,” and “in 1900” help signal relationships and chronology. This is a solid, coherent structure. To make progression more flexible and precise, avoid repeating the same reporting pattern and make references clearer. For example, “its was 46%” leaves the reader to infer that “its” refers to the other districts, while “the percentage” in the preceding sentence is also somewhat vague. Grouping the district figures in a more direct comparison would improve cohesion without adding unnecessary transitions.
Lexical Resource: Band 6.0
You use an adequate range of task-related vocabulary, including “considerable rise,” “increased significantly,” “dramatic rise,” “contribution,” and “proportion.” These choices communicate the broad trends, and the meaning remains clear despite some inaccurate or repetitive phrasing. However, several expressions are not natural for describing table data: “contribution ratio” and “contribution to the city’s population” are less precise than language about population share. There are also spelling errors, including “poulation,” and inconsistent capitalization of “New York City.” Aim for accurate collocations and vary repeated terms such as “population” and “rise.” More precise vocabulary would help distinguish changes in population numbers from changes in percentages.
Grammatical Range and Accuracy: Band 5.5
You use a mix of simple and complex sentence forms, including the contrast in “whereas the second and third tables…” and the time sequence in “Than it fell to 54% in 1900 and in 2000…”. Most sentences convey the intended meaning, but some grammatical errors remain. Examples include the missing article in “whereas second and third tables,” the awkward possessive construction “other four district’s,” and “Manhattan contribution was declined,” where the verb form is incorrect. There are also problems with agreement and sentence punctuation, such as “its was 46%” and the extra space before a comma in “1800 ,”. Check articles, plural forms, and verb patterns, especially when describing changes. More consistently accurate complex sentences would improve control.
See this exact question answered at other band scores. The same prompt compared across bands.
Browse more IELTS Writing model answers or get your own writing scored by the same AI examiner.