Band 5.5 IELTS Writing Task 1 Model Answer
Overall Band Score: 5.5 · Cambridge IELTS 20 · 2026-11-06
IELTS Writing Task 1 question
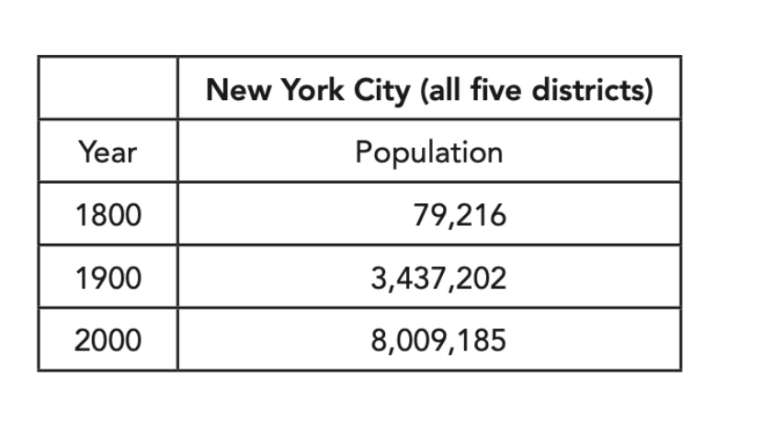
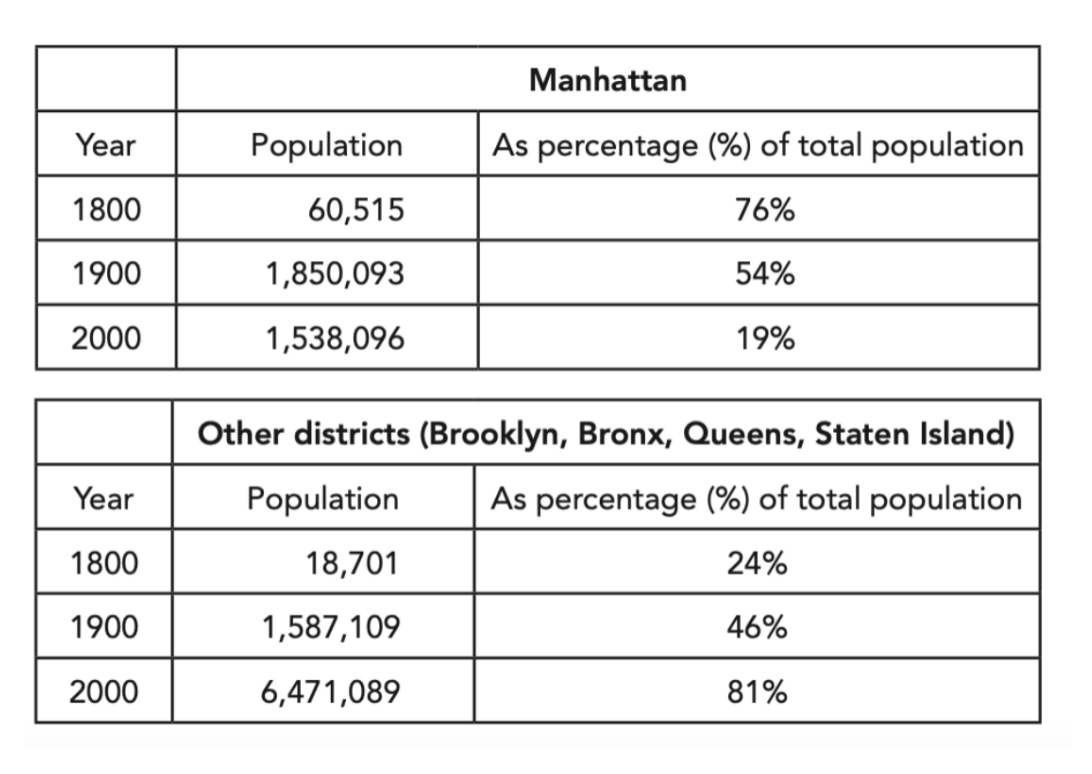
The first table below shows changes in the total population of New York City from 1800 to 2000. The second and third tables show changes in the population of the five districts of the city (Manhattan, Brooklyn, Bronx, Queens, Staten Island) over the same period.
Summarise the information by selecting and reporting the main features, and make comparisons where relevant.
Student answer (Band 5.5)
The tables illestrates changes in the total population of New York city from 1800 to 2000. The changes in the population of the five districts of the city, named as manhattan, brooklyn, bronx, queens and staten island over the same period.
Overall, the population of Manhattan district were low as compare to other four districts from 1800 to 2000. The overall population were increased gradually.
Initially, in 1800, the population of five districts were only 79,216. Then in 1900, they were rise up into 3, 437,202. Nowadays, in 2000, they are rised up into 8,009,185.
The population of manhattan district were very increased in 1800. They were rise up 76% of the total population. In 1900, there population percentage were decreased upto 54% of the total population. Gradually, in 2000, the population again less about 19% of the total population.
Finally, the other four districts named as brooklyn, bronx, queens and staten island were decreased about 24% of the population in 1800.Whereas, in 1900, the population were increased 46%. Again population were rise up into 81% of the total population.
AI examiner evaluation
| Criterion | Band |
|---|---|
| Task Achievement / Task Response | 5.5 |
| Coherence and Cohesion | 6.0 |
| Lexical Resource | 5.0 |
| Grammatical Range and Accuracy | 5.0 |
| Overall | 5.5 |
Task Achievement / Task Response: Band 5.5
You identify the overall rise in New York City’s population and report several relevant figures, including the city totals and the changing shares for Manhattan and the other districts. However, the overview is partly inaccurate: Manhattan was not consistently lower in population than the other four districts; it had 60,515 people in 1800 and 1,850,093 in 1900, exceeding the combined other districts in both years. The response also describes Manhattan’s population as increasing in 1800, although the figures show its population rose to 1900 and then fell by 2000. Some comparisons are therefore unclear or misrepresented, and the account relies heavily on percentages rather than explaining the contrasting population trends. State the key changes accurately and distinguish population totals from shares.
Coherence and Cohesion: Band 6.0
The response has a recognisable structure: an introduction, an overview, and separate paragraphs for the city total, Manhattan, and the other districts. This gives the reader a basic route through the information, and time markers such as “Initially,” “in 1900,” and “in 2000” help establish chronology. However, progression is sometimes mechanical, with repeated “Then,” “Gradually,” and “Again,” and the final paragraph does not clearly connect the percentages to the population figures. Some references are also difficult to follow, such as “they” in the city-total paragraph and “there population percentage.” Group the information around the main contrast—Manhattan’s declining share versus the other districts’ growth—and use clearer references and transitions.
Lexical Resource: Band 5.0
You use relevant topic vocabulary, including “total population,” “districts,” and “percentage,” so the subject is generally understandable. However, the range is limited and several word choices or collocations are inaccurate, sometimes making the intended trend unclear. For example, “were decreased about 24%” should describe a share, not a decrease, while “rise up into” is repeatedly used where “rose to” or “increased to” is needed. There are also spelling and capitalization errors in “illestrates,” “manhattan,” and “staten island.” Aim for precise verbs for describing data and vary them appropriately; check spelling and use standard names consistently.
Grammatical Range and Accuracy: Band 5.0
The response mainly uses simple sentences and attempts a few longer structures, including the opening sentence and the contrast introduced by “Whereas.” However, grammatical control is limited, and errors occur across much of the response. Subject–verb agreement is inconsistent in phrases such as “the population … were” and “the tables illustrates”; verb forms are also faulty in “they were rise up” and “they are rised up.” Articles and possessives are sometimes missing or incorrect, as in “there population percentage.” These errors can make the relationships between figures and trends harder to understand. Practise accurate past-tense reporting, singular agreement with “population,” and complete sentence structures before adding more complex clauses.
See this exact question answered at other band scores. The same prompt compared across bands.
Browse more IELTS Writing model answers or get your own writing scored by the same AI examiner.