Band 5.5 IELTS Writing Task 1 Model Answer
Overall Band Score: 5.5 · Cambridge IELTS 20 · 2026-11-07
IELTS Writing Task 1 question
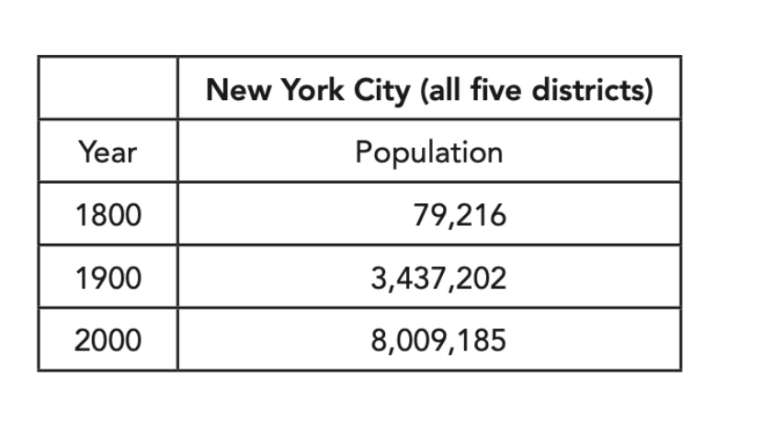
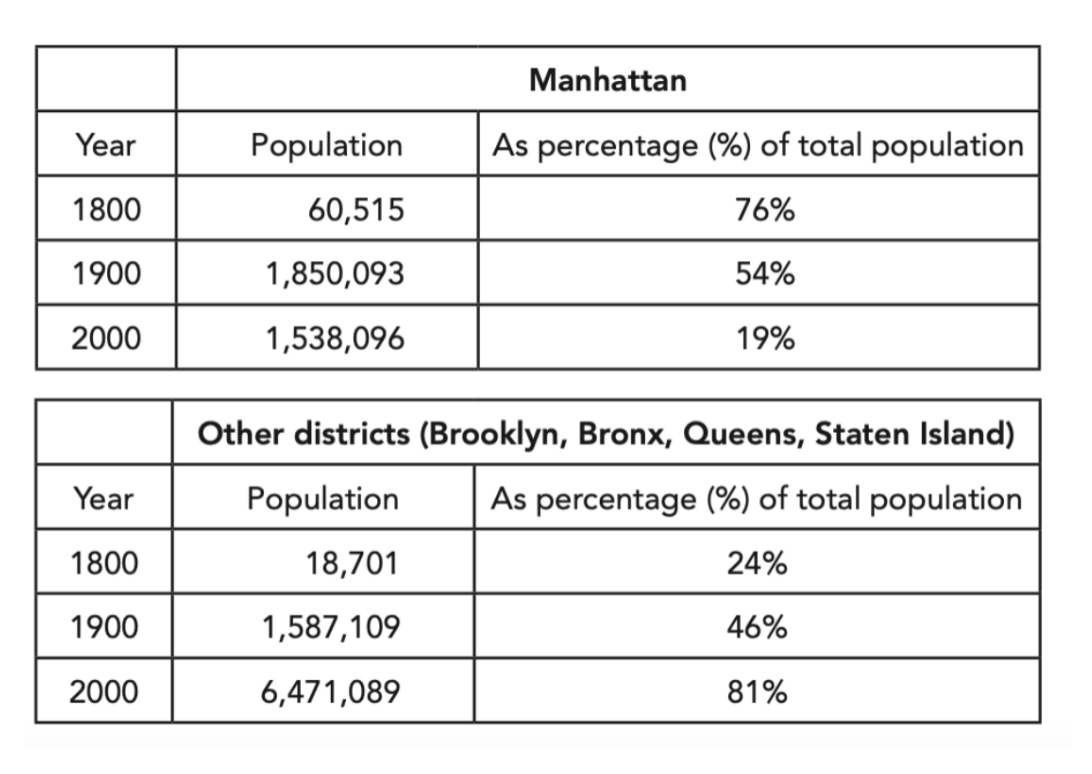
The first table below shows changes in the total population of New York City from 1800 to 2000. The second and third tables show changes in the population of the five districts of the city (Manhattan, Brooklyn, Bronx, Queens, Staten Island) over the same period.
Summarise the information by selecting and reporting the main features, and make comparisons where relevant.
Student answer (Band 5.5)
The first table illustrates the total population of the New York City from 1800 to 2000, however, the second and third table demostrate changes in the population of five different districts of the city, which are Manhattan, Brooklyn, Bronx, Queens, Staten Islands over the same period of time.
In the first table, it indicates that there has been drastic rise in population of the city (in all five ditricts) over period of three hundred years. The second and third table shows the population growth of Manhattan and of other four districts over the same period.
In the 1800s, the population od New York City was relatively as low as 79,216, including all 5 districts and have been dractically increased over the years, reaching up to 8,009,185 in the 2000s. New York is a metropolitan city, being the hub of business and technology, It attracts not just people from over teh States but also migrants from all over the world to build their carees or live a better a life, it is one of the main reason of the increase in population in the city.
On the contrary, the second and third table demostrates on which district contributes the most and least towards the population of the city, with Manhattan being the most populated in teh 1800s and 1900s consecutively, though in 2000s it still hold 19% of the population of the city. Whereas the other four districts as an accumulation have 81% of the population in the 2000.
AI examiner evaluation
| Criterion | Band |
|---|---|
| Task Achievement / Task Response | 6.0 |
| Coherence and Cohesion | 5.5 |
| Lexical Resource | 5.5 |
| Grammatical Range and Accuracy | 5.0 |
| Overall | 5.5 |
Task Achievement / Task Response: Band 6.0
You identify the overall rise in New York City’s population and the shift in population share from Manhattan to the other four districts. The figures of 79,216 in 1800, 8,009,185 in 2000, and the 19%/81% shares in 2000 are accurate. However, the comparison is incomplete: Manhattan’s population rose to 1,850,093 in 1900 before falling to 1,538,096 in 2000, a key contrast that is not clearly reported. The statement that Manhattan was the most populated district in both 1800 and 1900 is not supported by the tables, which give only Manhattan and the combined total for the other districts. The explanation about business, technology and migration is speculative and not shown by the data. Focus on the table’s trends and comparisons, and make the overview more precise.
Coherence and Cohesion: Band 5.5
The response has a recognisable sequence: it introduces the tables, describes the citywide trend, and then turns to Manhattan and the other districts. This gives the reader a basic overall structure. However, progression is weakened by repeated references to what each table shows rather than grouping the key comparisons into a clear overview and supporting details. Connectors such as “On the contrary” do not express the relationship accurately; the final paragraph is a contrast, not a contradiction. The long sentence about migration also interrupts the data-focused progression. Use separate paragraphs for the overview and the main figures, and link comparisons directly—for example, contrast Manhattan’s falling population after 1900 with the continued growth of the other districts.
Lexical Resource: Band 5.5
You use some relevant task vocabulary, including “total population,” “districts,” “percentage,” and “population growth,” and the main message remains understandable. There are also attempts at more formal phrasing, such as “as an accumulation,” but this is not a natural collocation; “combined” or “collectively” would be clearer. Several spelling errors—“demostrate,” “ditricts,” “dractically,” and “teh”—are noticeable, while phrases such as “relatively as low as” and “a better a life” show imprecise word choice. “In the 2000s” is also less exact than “in 2000” when reporting a table year. Aim for accurate, concise vocabulary for describing figures and trends, and proofread spelling and collocations.
Grammatical Range and Accuracy: Band 5.0
You attempt a mixture of simple statements and longer complex sentences, including clauses introduced by “though” and “whereas.” However, grammatical control is inconsistent, and several errors make the relationships between ideas less clear. For example, “the second and third table shows” has a subject–verb agreement error, while “the population … was … and have been … increased” combines incompatible verb forms. The sentence beginning “New York is a metropolitan city” runs several independent ideas together, with problematic punctuation and sentence boundaries. Articles and number forms also need attention, as in “the New York City” and “all 5 districts.” Practise building accurate sentences around one main comparison at a time, checking agreement, tense, articles, and punctuation before adding subordinate clauses.
See this exact question answered at other band scores. The same prompt compared across bands.
Browse more IELTS Writing model answers or get your own writing scored by the same AI examiner.