Band 4.0 IELTS Writing Task 1 Model Answer
Overall Band Score: 4.0 · Cambridge IELTS 20 · 2026-11-07
IELTS Writing Task 1 question
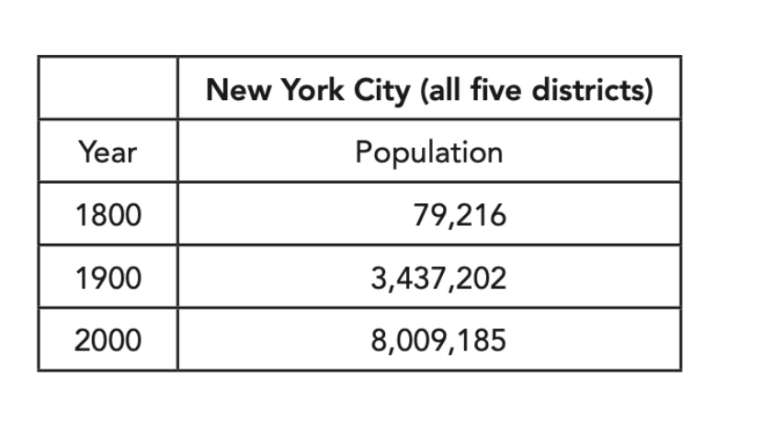
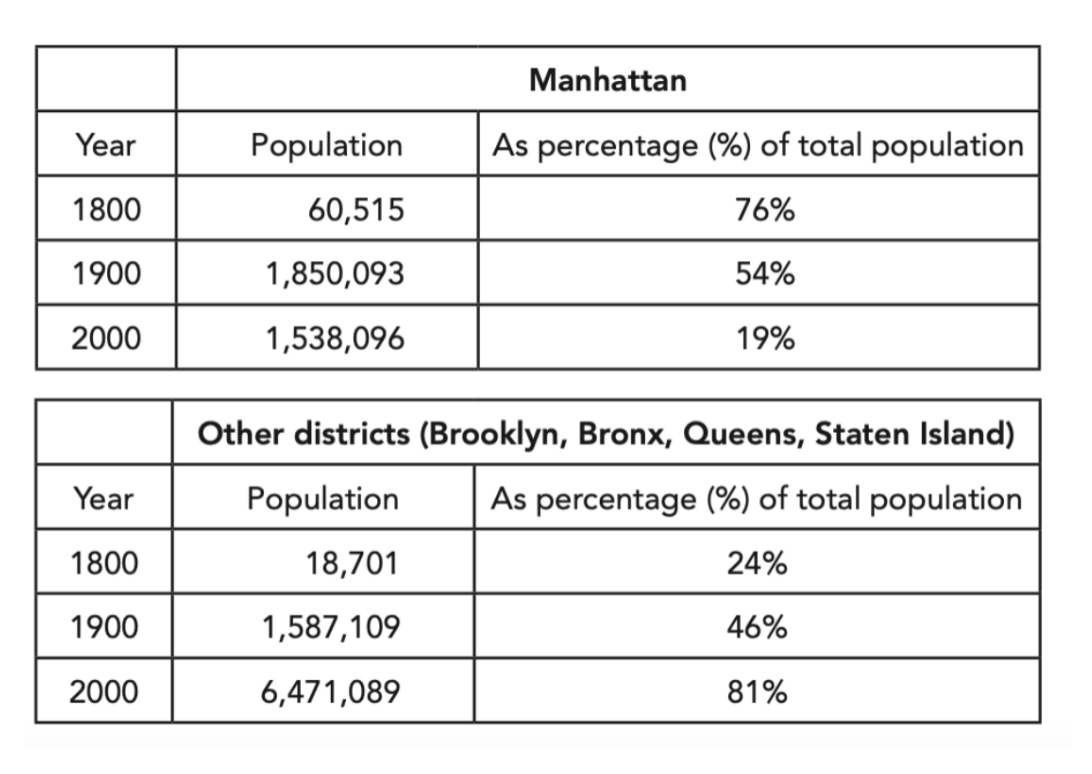
The first table below shows changes in the total population of New York City from 1800 to 2000. The second and third tables show changes in the population of the five districts of the city (Manhattan, Brooklyn, Bronx, Queens, Staten Island) over the same period.
Summarise the information by selecting and reporting the main features, and make comparisons where relevant.
Student answer (Band 4.0)
The table below illustrates the change of population level of New York city with five districts of the city: Manhattan, Brooklyn, Bronx, Queens and Staten Island (in percentage) fromm 1800 to 2000.
Overall, it is clear that the population rate of all five districts of New York city has been increased rapidly with 79216 in 1800 to [redacted phone] in the year 2000.
AI examiner evaluation
| Criterion | Band |
|---|---|
| Task Achievement / Task Response | 3.0 |
| Coherence and Cohesion | 4.5 |
| Lexical Resource | 4.5 |
| Grammatical Range and Accuracy | 4.5 |
| Overall | 4.0 |
Task Achievement / Task Response: Band 3.0
You identify the broad subject and give one relevant overall comparison: New York City’s population rose from 79,216 in 1800 to 8,009,185 in 2000. However, the response is far too brief to summarise the tables and omits the key district-level changes. In particular, Manhattan’s population peaked in 1900 and then fell, while the other four districts grew to account for 81% of the total by 2000; neither feature is reported. The statement that the population of “all five districts” increased rapidly is also too general to capture Manhattan’s decline after 1900. The response is 53 words, 97 short of the required minimum, and 9 words copied from the prompt were not counted. Add a fuller overview and select supporting figures for each period.
Coherence and Cohesion: Band 4.5
The response has a basic, recognisable structure: an introductory sentence is followed by an overview beginning “Overall,” so the reader can distinguish the topic from the main point. The ideas are also presented in a sensible order, moving from the tables to a broad trend. However, the response ends after this overview, with no body paragraph to organise comparisons or develop the information. As a result, progression is very limited, and the relationship between the citywide total and the district figures is not explained. Build a short paragraph around Manhattan’s changing share and another around the other districts’ growth, using clear links such as “By contrast” and “By 2000” to guide the reader.
Lexical Resource: Band 4.5
You use a small set of relevant terms, including “population,” “districts,” and “percentage,” and the central topic remains understandable. However, the range is limited, and some expressions are imprecise or awkward for describing statistical change. “Population level” would be more naturally expressed as “population,” while “population rate” does not accurately describe the number of residents or their share of the city total. The spelling “fromm” is also an error. Use precise terms such as “population,” “population share,” “accounted for,” and “rose/fell” to describe the figures. A wider range of accurate trend vocabulary would help you report the contrasting changes across the three years.
Grammatical Range and Accuracy: Band 4.5
The response includes a simple introductory sentence and a longer sentence beginning “Overall,” with a subordinate clause, so there is an attempt to vary sentence structure. Meaning is generally recoverable, but grammatical control is uneven. In “the population rate … has been increased,” the passive construction is inappropriate; write “the population … increased” or “the population has increased.” The phrase “from 79216 in 1800 to 8009185 in the year 2000” also needs clearer punctuation and number formatting, and “New York city” should use a capital C in the city name. Practise accurate past-tense reporting for completed historical periods and use straightforward sentence patterns to compare the figures.
See this exact question answered at other band scores. The same prompt compared across bands.
Browse more IELTS Writing model answers or get your own writing scored by the same AI examiner.