Band 5.0 IELTS Writing Task 1 Model Answer
Overall Band Score: 5.0 · Cambridge IELTS 20 · 2026-11-07
IELTS Writing Task 1 question
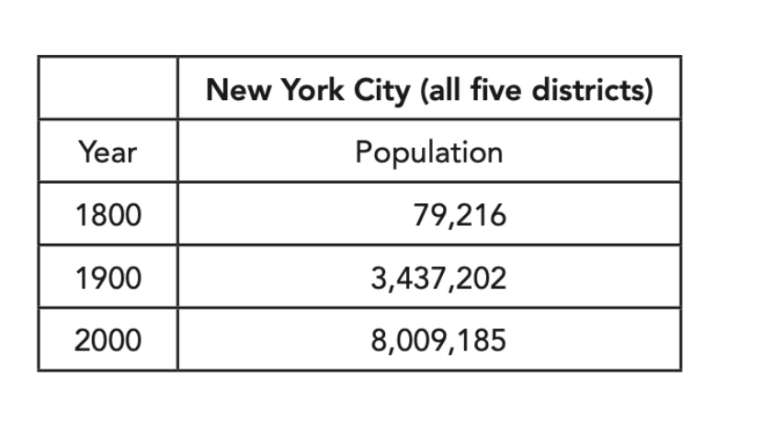
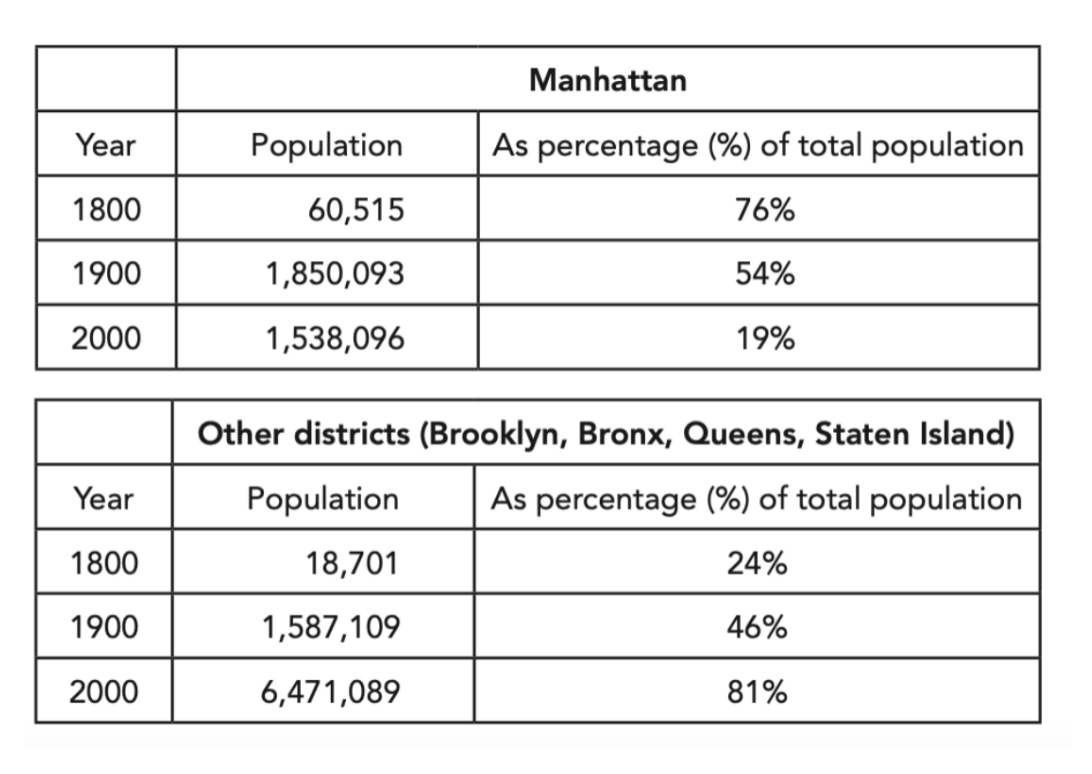
The first table below shows changes in the total population of New York City from 1800 to 2000. The second and third tables show changes in the population of the five districts of the city (Manhattan, Brooklyn, Bronx, Queens, Staten Island) over the same period.
Summarise the information by selecting and reporting the main features, and make comparisons where relevant.
Student answer (Band 5.0)
The tables campares between changes of population from 1800 to 2000 in big cities in united state of america.
Overall,it is clear that the population in diffrente cities is highly increasing over the years.Furthemore the the percetages of the population in manhattan is decreasing unlike other districts which is goes up.
Looking at the details,the population in New York city it grows 100 times from nearly 80000 to 8 milions between 1800 to 2000,Which is crazy to thing to know about in other way it means that peopls like the place more that could be because the rise of technology and high business and marketing jobs and buildings,while Manhattan and other districts shows also a growth in populations over the same periode but for manhattan the percentages of population dips from 76% to 19% unlike other disricts like brooklyn, bronx, queens, staten island that thier percenteges increases from 24% to 81%.
Regarding the remainig details about the cities, New York city recorded in 2000 growth of 8 millions in populationthe highest growth in all the other cities and to be more specific if we combines the numbers of all other cities in the tables then it will equalize the numbers of New York city alone.
AI examiner evaluation
| Criterion | Band |
|---|---|
| Task Achievement / Task Response | 5.0 |
| Coherence and Cohesion | 5.0 |
| Lexical Resource | 5.0 |
| Grammatical Range and Accuracy | 5.0 |
| Overall | 5.0 |
Task Achievement / Task Response: Band 5.0
You identify the broad trends: New York City’s total population rose substantially, while Manhattan’s share fell and the other districts’ combined share increased. However, the response only partly reports the tables’ key information. The total is described as growing “100 times,” which is inaccurate: it rose from 79,216 to 8,009,185, or roughly 100-fold, but the wording is imprecise and the intermediate 1900 figure is omitted. More importantly, you say Manhattan and the other districts both grew, although Manhattan’s population actually fell from 1,850,093 in 1900 to 1,538,096 in 2000. The claim that the other districts’ numbers “equalize” New York City’s total is also unclear. Select and compare the main figures more accurately, especially the contrasting population changes after 1900.
Coherence and Cohesion: Band 5.0
The response has a basic structure, with an opening, an overview, and paragraphs beginning “Looking at the details” and “Regarding the remaining details.” This gives the reader some sense of organisation. However, the progression is not consistently clear: the final paragraph repeats the 2000 total and introduces an unclear comparison rather than developing a new feature. Several long sentences combine multiple points, making relationships difficult to follow, particularly the sentence beginning “the population in New York city it grows.” Linking expressions such as “unlike” and “while” are attempted, but some connections are awkward or repetitive. Group the information into a clear overview and focused comparisons, and use shorter sentences with explicit references to the figures being compared.
Lexical Resource: Band 5.0
You use some relevant vocabulary for describing data, including “population,” “percentages,” “decreasing,” “increases,” and “growth.” These choices show an attempt to discuss trends and comparisons. However, the range is limited and several word choices or collocations are inaccurate, which sometimes makes the meaning difficult to interpret. For example, “the tables compares between changes” and “the population … grows 100 times” are not natural ways to describe the information. Informal expressions such as “which is crazy to think” are unsuitable for an academic report, while “cities” is repeatedly used where “districts” is more accurate. Frequent spelling errors, including “diffrente,” “percetages,” and “disricts,” also reduce clarity. Use precise data-reporting language and check spelling carefully.
Grammatical Range and Accuracy: Band 5.0
You attempt some longer sentences and use subordinate links such as “while,” “unlike,” and “that could be because,” but complex structures are often faulty, and many sentences contain errors. For example, “the population in New York city it grows” has an unnecessary subject and an incorrect verb form; “the percentages … is decreasing” has subject–verb disagreement; and “other districts shows” also needs agreement. Tense and sentence boundaries are inconsistent, as in “between 1800 to 2000,Which,” where the preposition and punctuation are incorrect. Missing spaces after full stops and commas further affect readability. Build accuracy first with clear past-tense comparisons, then combine clauses only when their grammatical relationship is controlled.
See this exact question answered at other band scores. The same prompt compared across bands.
Browse more IELTS Writing model answers or get your own writing scored by the same AI examiner.